Key Performance Indicators (KPIs) for Quick Service Restaurants (QSR)
Docyt has identified several key performance indicators (KPIs) that are specifically important for quick service restaurant owners:
- Beverage Costs
- Cost of Goods Sold
- Prime Costs
- Sales per Labor Hour
- Spend per Ticket
- Total Food Costs
- Total Labor Cost
- Total Occupancy Costs
- Total Other Costs
- Total Paper Costs
- Total Sales
Accessing the QSR Dashboard and KPIs
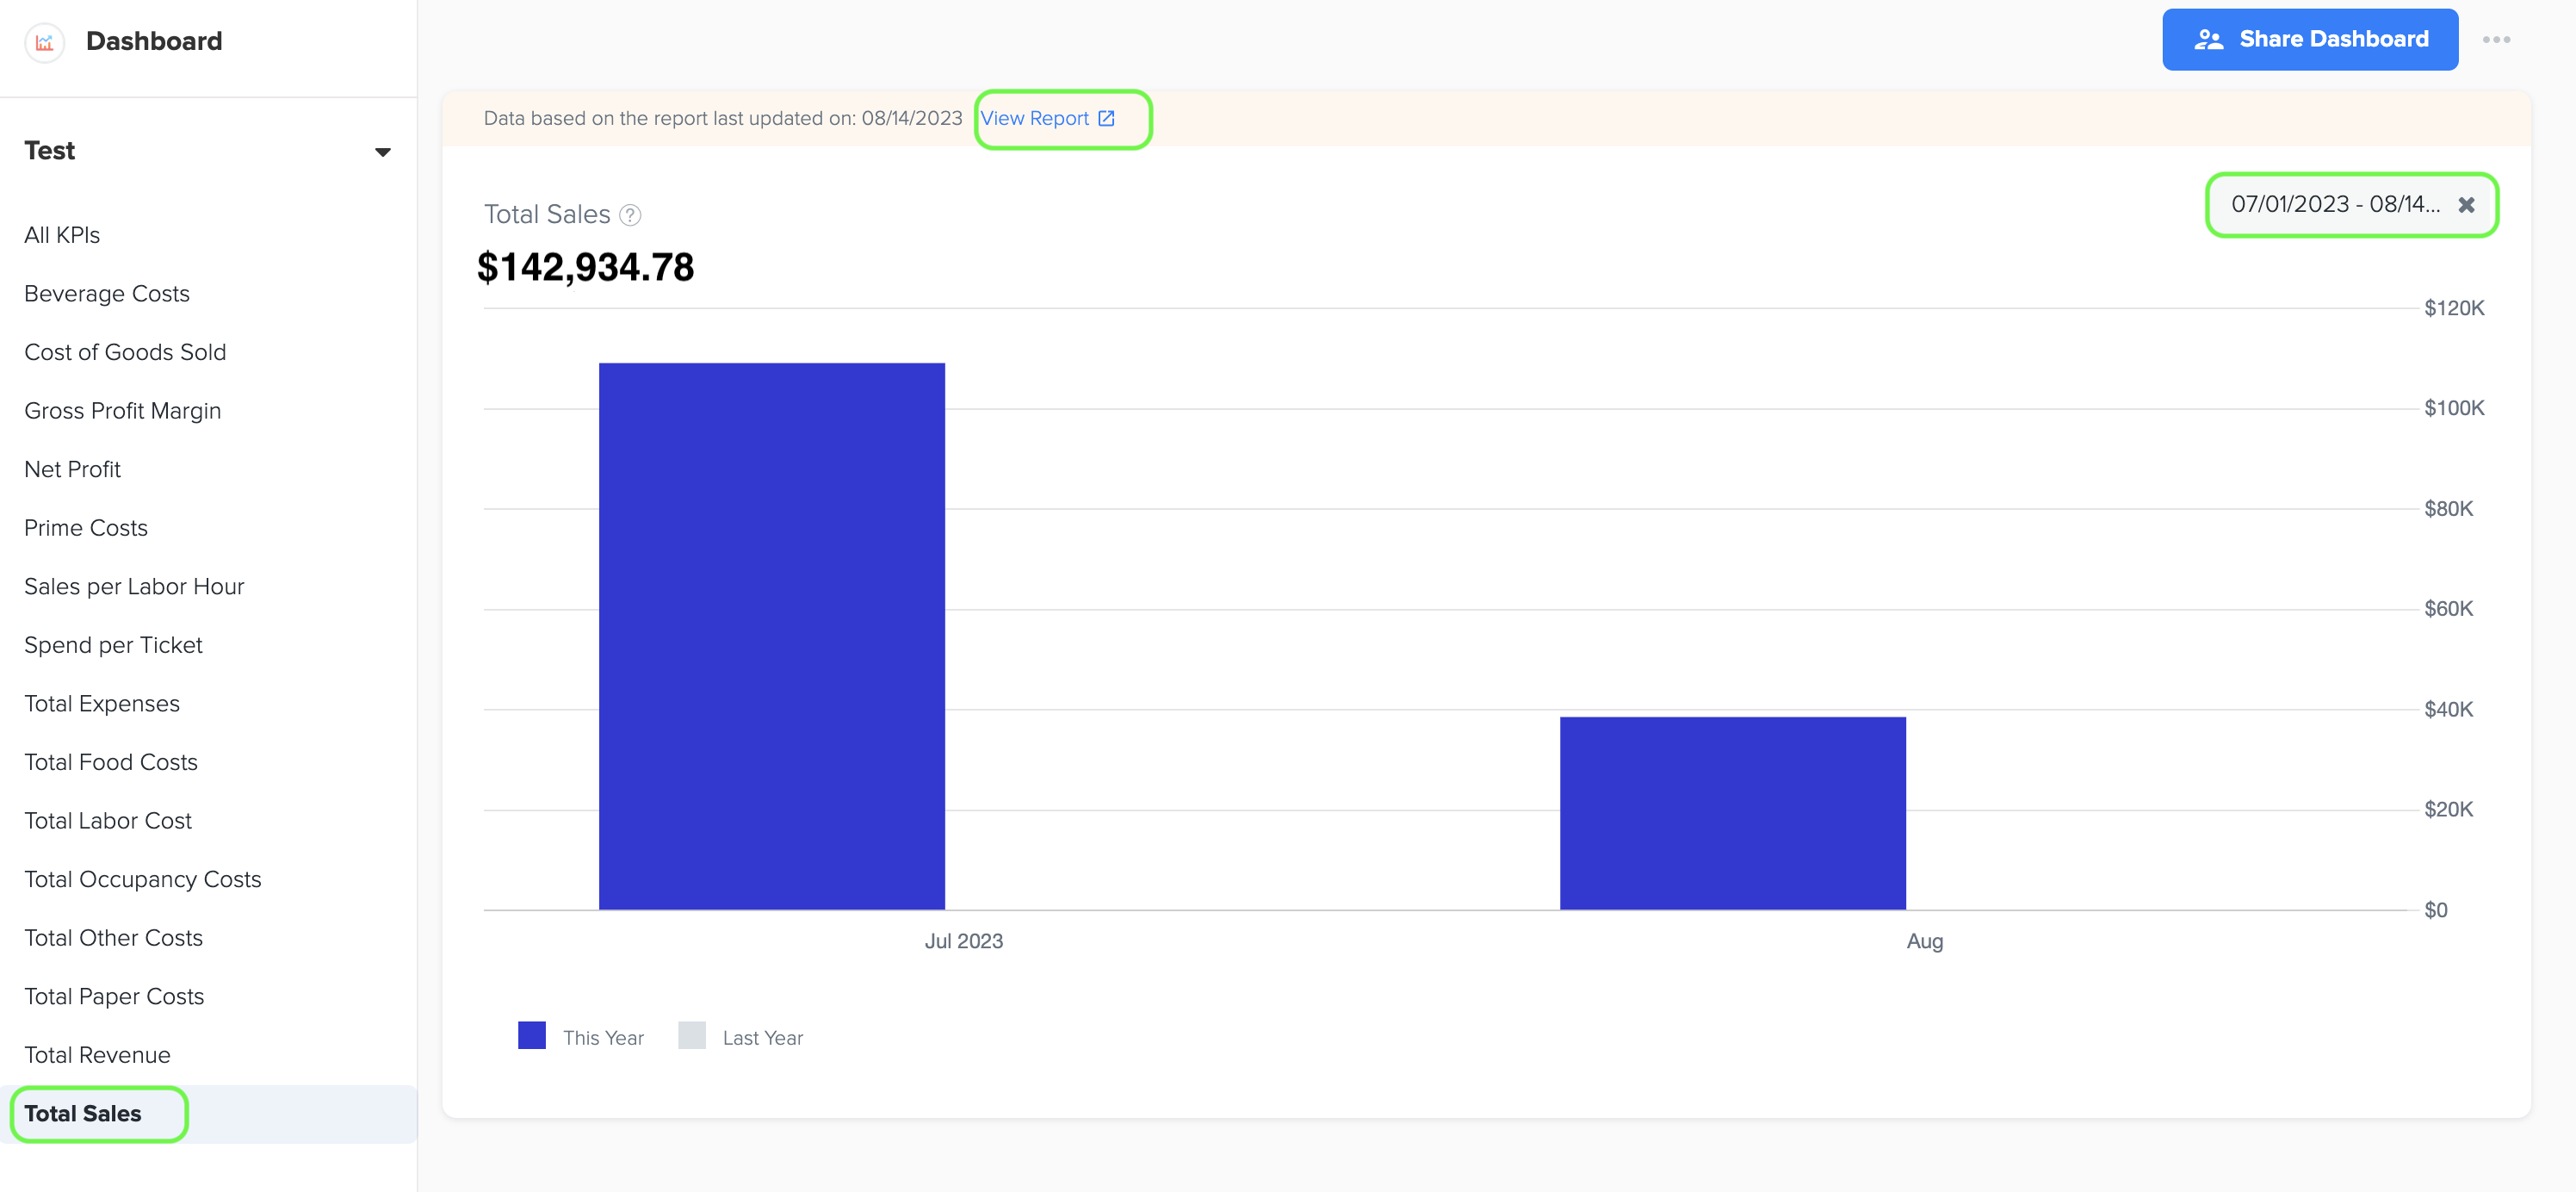
1. To access the dashboard, simply click on the 'Dashboard' option in the menu bar and choose the specific dashboard you desire from the dropdown list.

2. To access the graph displaying the Key Performance Indicator (KPI), simply click on the desired KPI name in the left navigation menu. This allows you to easily view the performance metric you are interested in.

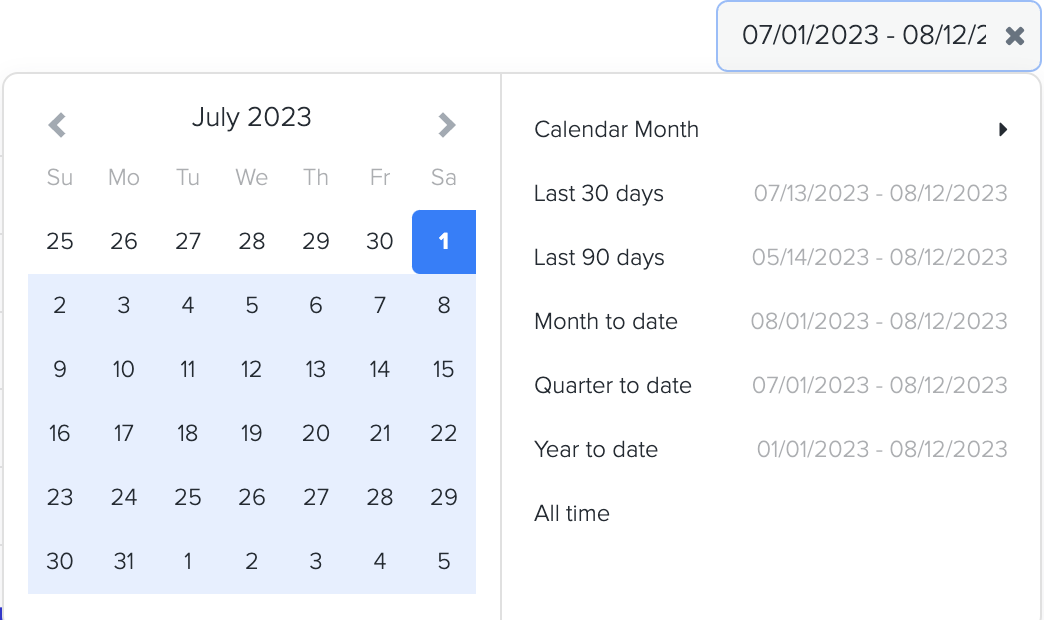
3. To easily view the data in a clear and organized way, you can simply choose the start and end dates in each KPI graph to select the desired time period. This allows you to conveniently visualize the information and gain valuable insights.
1. Net Profit
1. To determine the net profit (before tax) of a quick service restaurant business, Docyt utilizes the following formula:
Net Profit (before tax) = Total Revenue - Cost of Goods Sold (COGS) - Total Expenses (Operating Expenses).
Where,
Total Revenue includes all the income generated from sales of food, beverages, and any other products or services offered by the restaurant.
Cost of Goods Sold (COGS) includes the direct costs associated with producing or purchasing the food and beverages sold. It typically includes the cost of ingredients, packaging, and any other costs directly related to the production of the items sold.
Total Expenses (Operating Expenses) are the day-to-day expenses incurred in running the restaurant. It includes rent, utilities, salaries and wages of staff, marketing and advertising costs, insurance, and other expenses necessary for the operation of the business.
2. The Net Profit dashboard in Docyt displays the Net Profit Amount on the Y-axis and the Month on the X-axis. Additionally, it includes a grey color bar that allows for a month-to-month comparison with the net profit amount from the previous year. This visual representation provides valuable insights into the financial performance of the business over time.
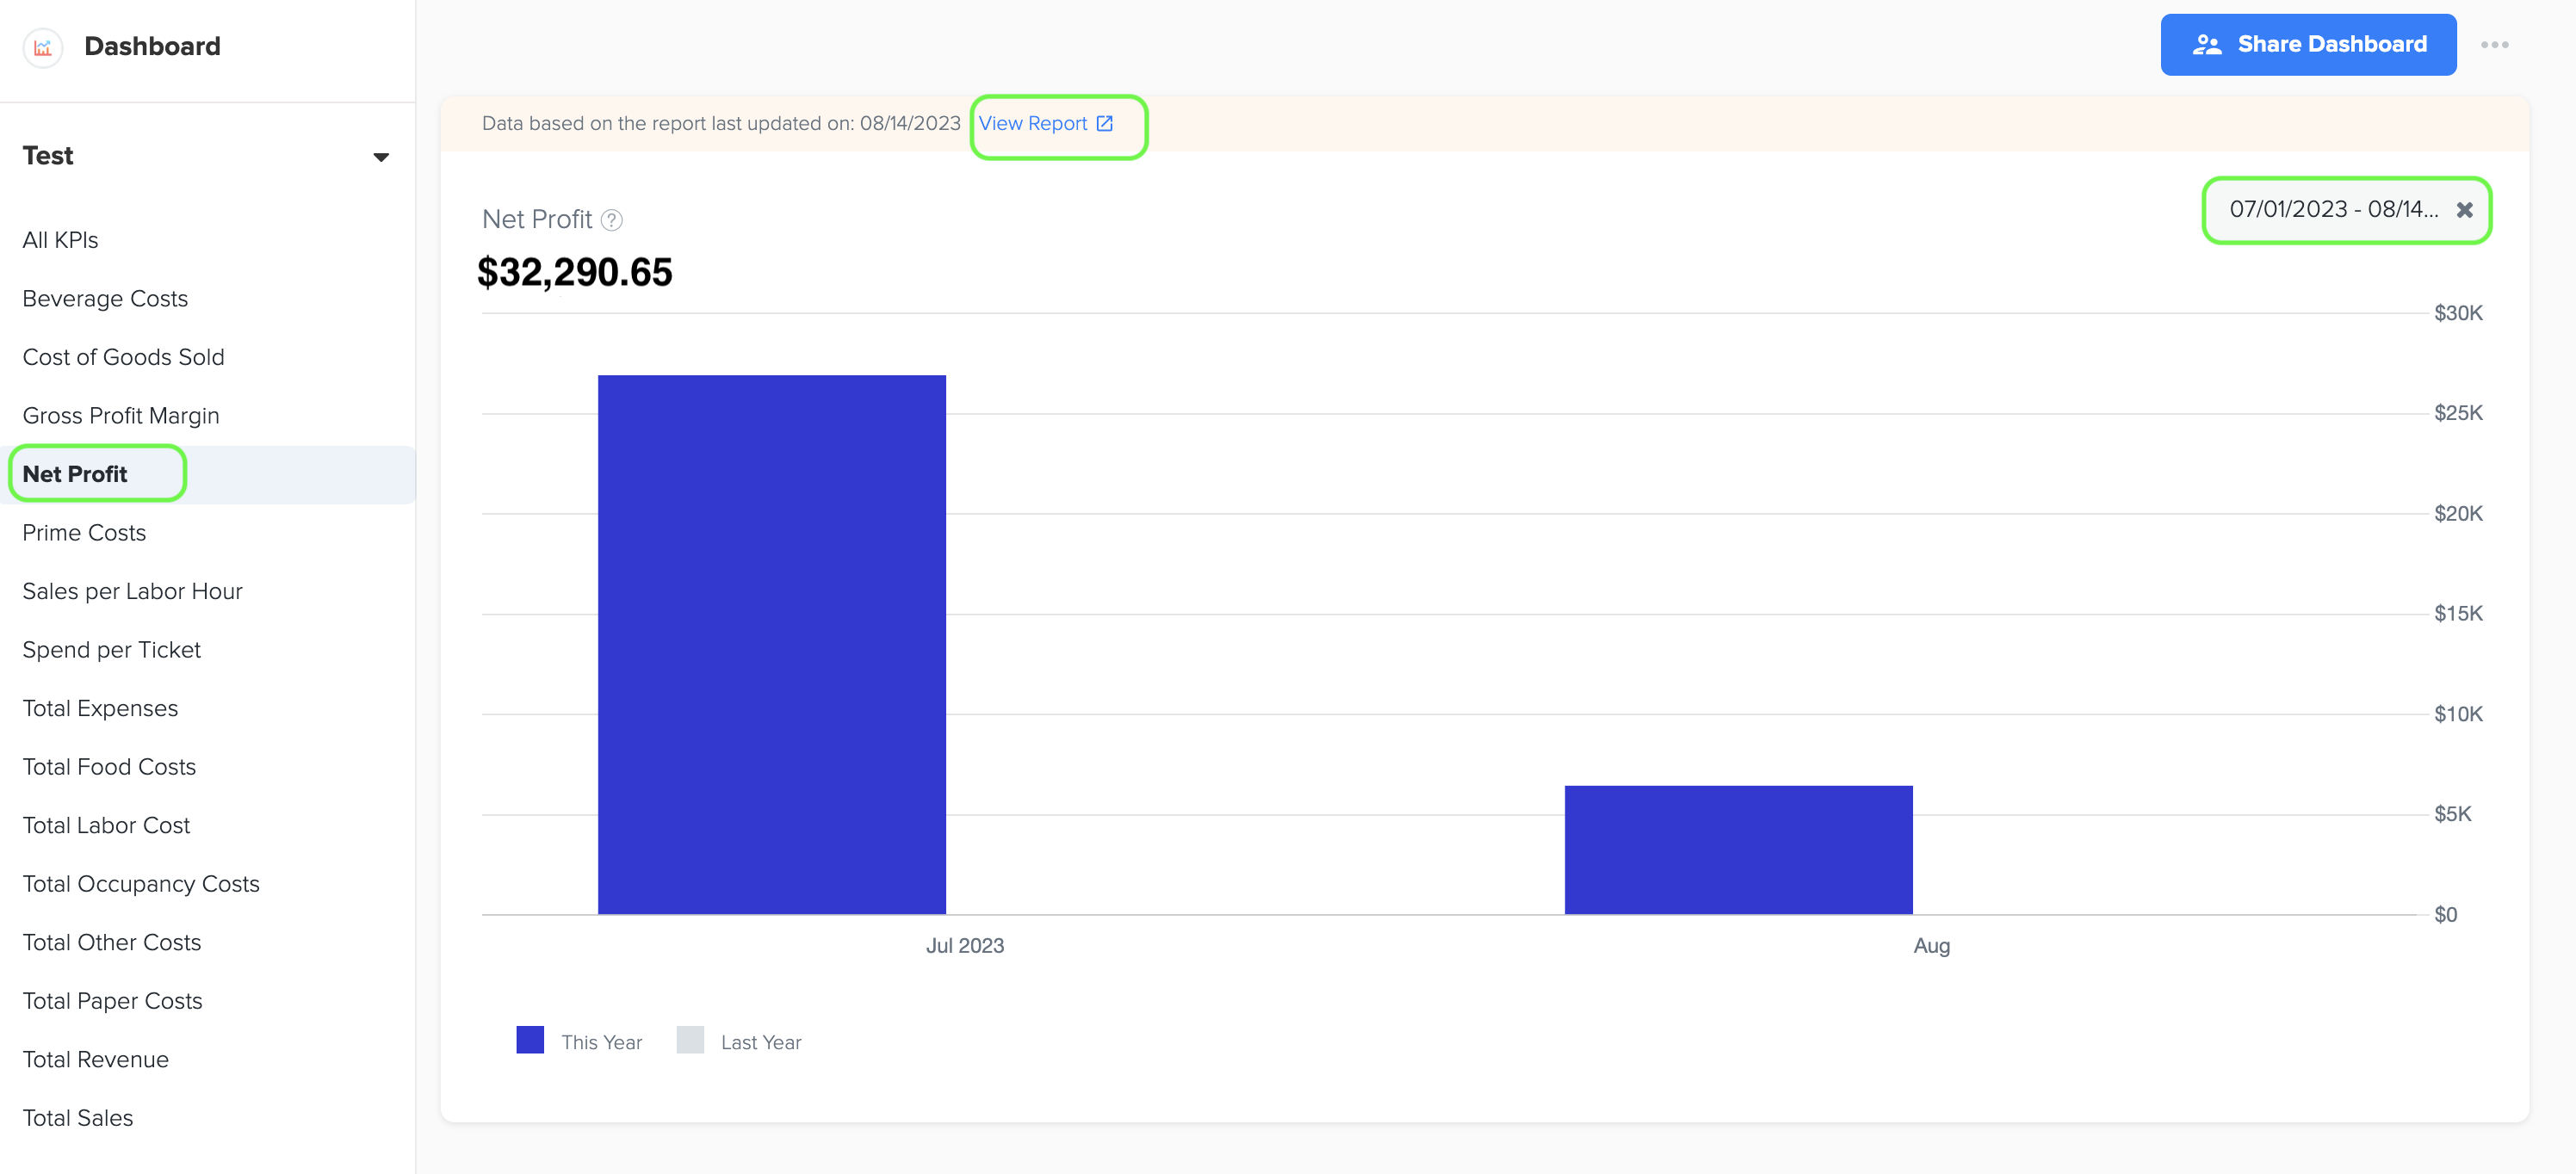
3. Furthermore, while viewing the graph page, you have the option to click on the 'View Report' link. This will provide you with a detailed report and allow you to see the specific data source that was utilized to create the graph.
4. The data for this bar graph is obtained from the Net Profit amount listed in the Profit and Loss statement, which can be found in the Basic menu under the Business Reports section of Docyt.
2. Total Expenses (Excluding COGS)
1. Total expenses of a quick service restaurant business, excluding the Cost of Goods Sold (COGS), refer to all the costs and expenditures incurred in operating the establishment, excluding the direct costs associated with producing or purchasing the food and beverages sold.
These expenses typically include the following categories:
-
There are ongoing costs necessary for the day-to-day operation of the restaurant. It includes expenses such as rent or lease payments for the establishment, utilities (electricity, water, gas), insurance premiums, licenses and permits, marketing and advertising expenses, and office supplies.
-
Labor Costs: This includes the wages, salaries, and benefits paid to the restaurant's employees, including cooks, servers, hosts/hostesses, dishwashers, and managerial staff. Labor costs can be a significant portion of the total expenses for a quick service restaurant.
-
Occupancy Expenses: These expenses relate to the physical space used by the restaurant. They include rent, property taxes, property insurance, and any maintenance or repairs required for the restaurant's premises.
-
Marketing and Advertising: These expenses encompass the costs associated with promoting the restaurant, such as advertising campaigns, online marketing efforts, social media management, website maintenance, and other promotional activities.
-
General and Administrative Expenses: These include general overhead costs such as office supplies, accounting fees, legal fees, licenses, permits, and other administrative expenses necessary to run the restaurant's operations smoothly.
2. By excluding the COGS from the total expenses, the focus is shifted to the indirect costs associated with running the quick service restaurant. These expenses provide a broader view of the operational costs, excluding the direct costs directly tied to the production of the food and beverages.
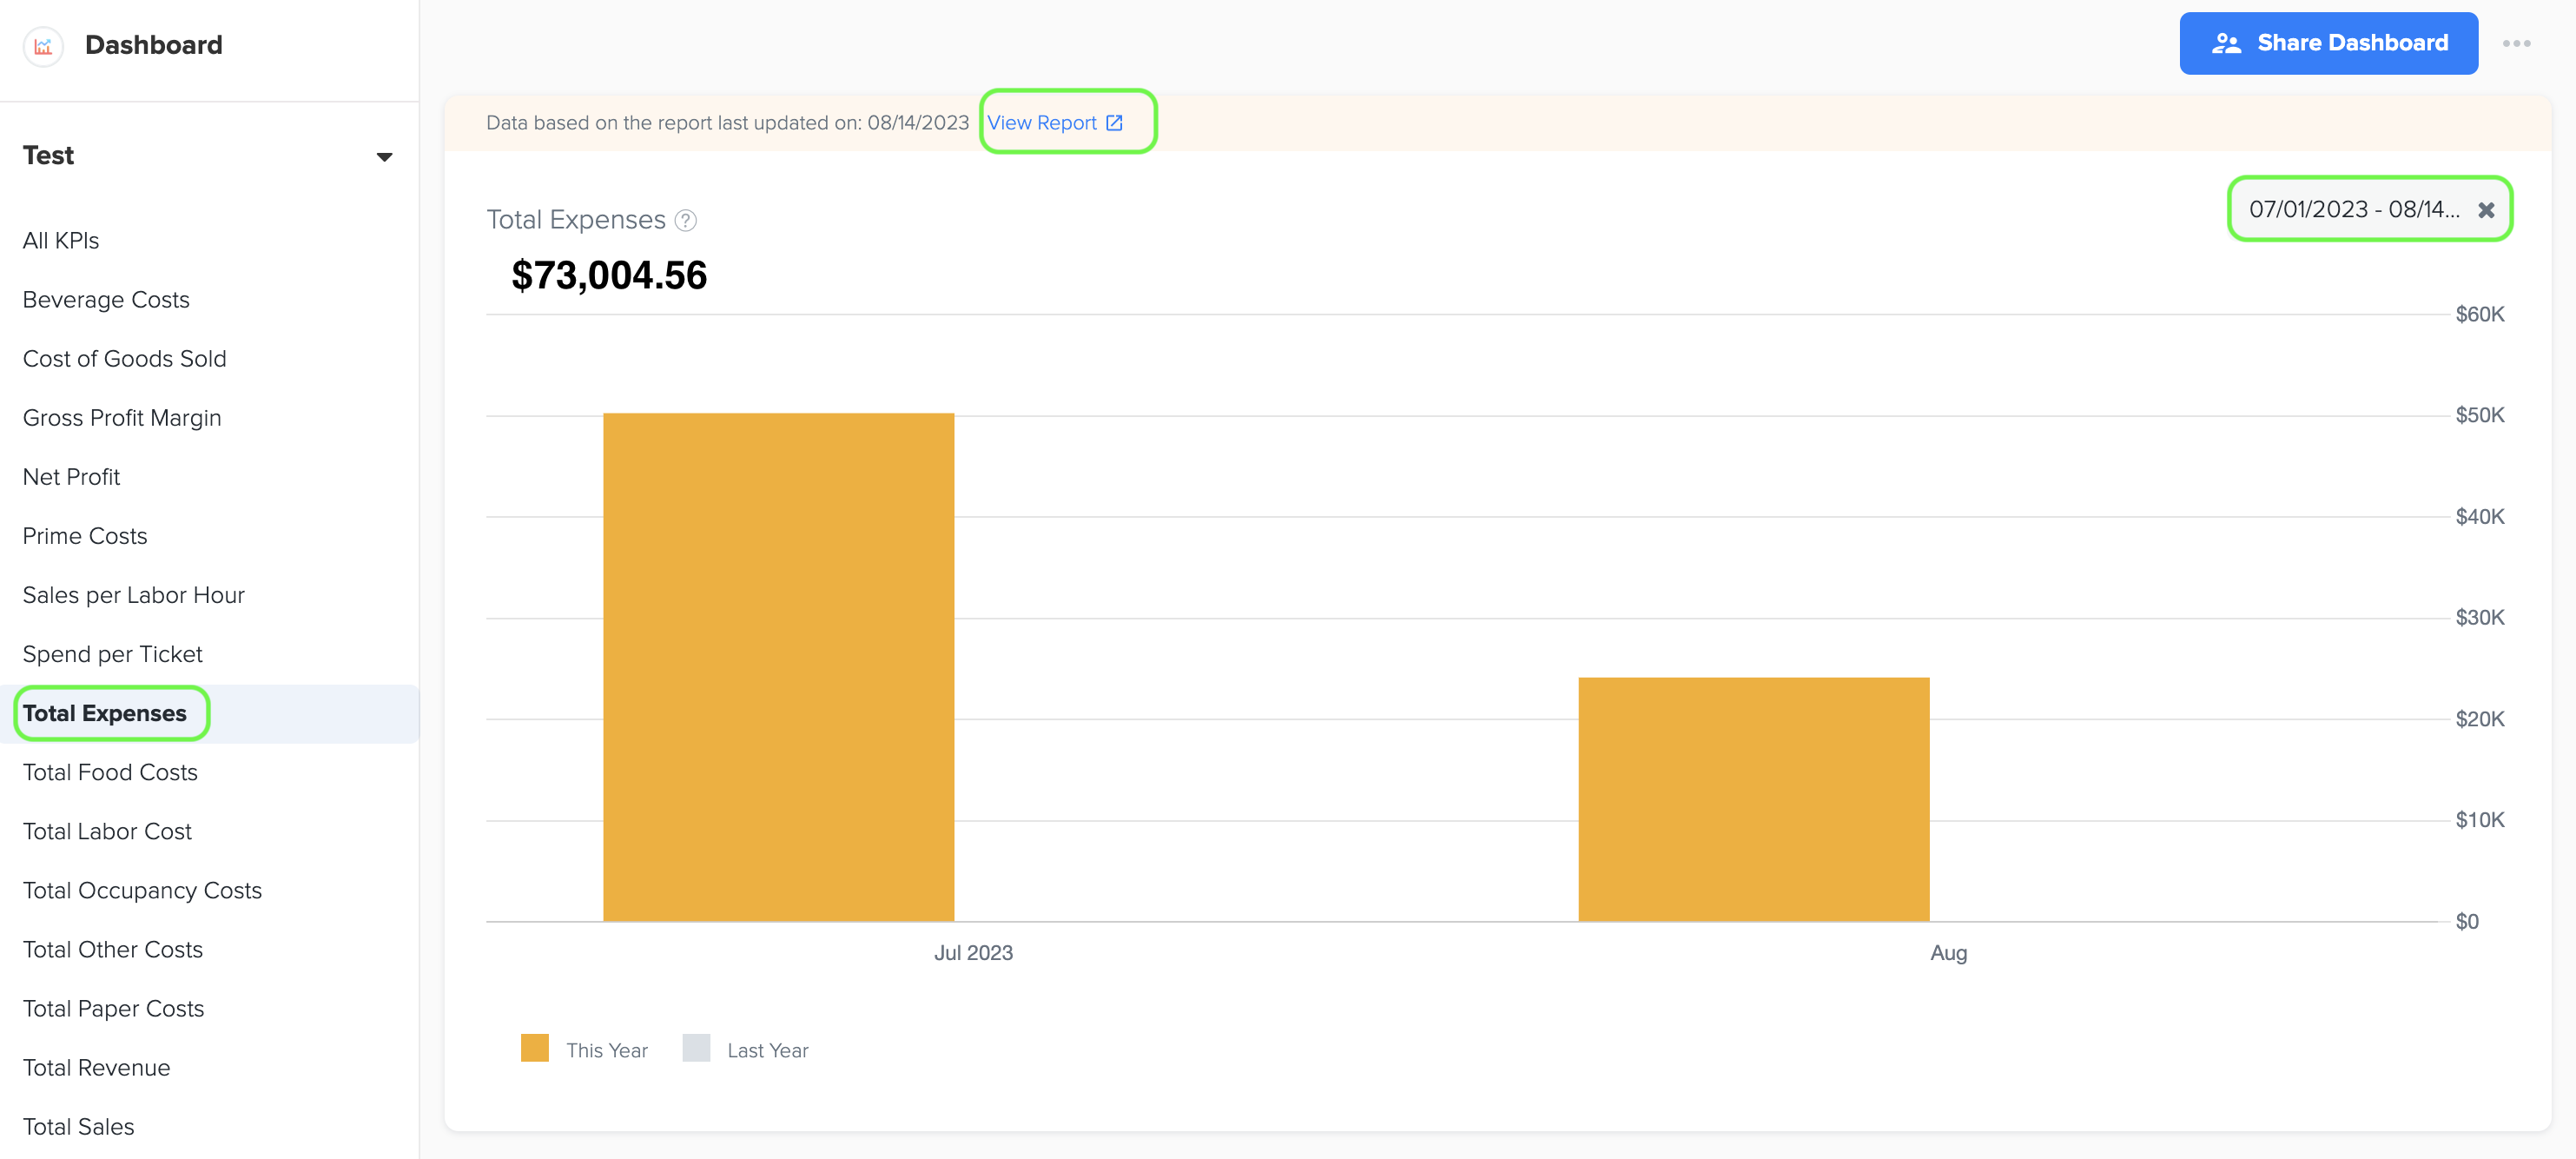
3. To generate the bar graph, simply select the desired time period by choosing the start and end dates. Furthermore, while viewing the graph page, you have the option to click on the 'View Report' link. This will provide you with a detailed report and allow you to see the specific data source that was utilized to create the graph.
4. The data for this graph is obtained from the Total Expenses amount listed in the Profit and Loss statement. You can find the Profit and Loss statement in the Basic menu under the Business Reports section of Docyt.
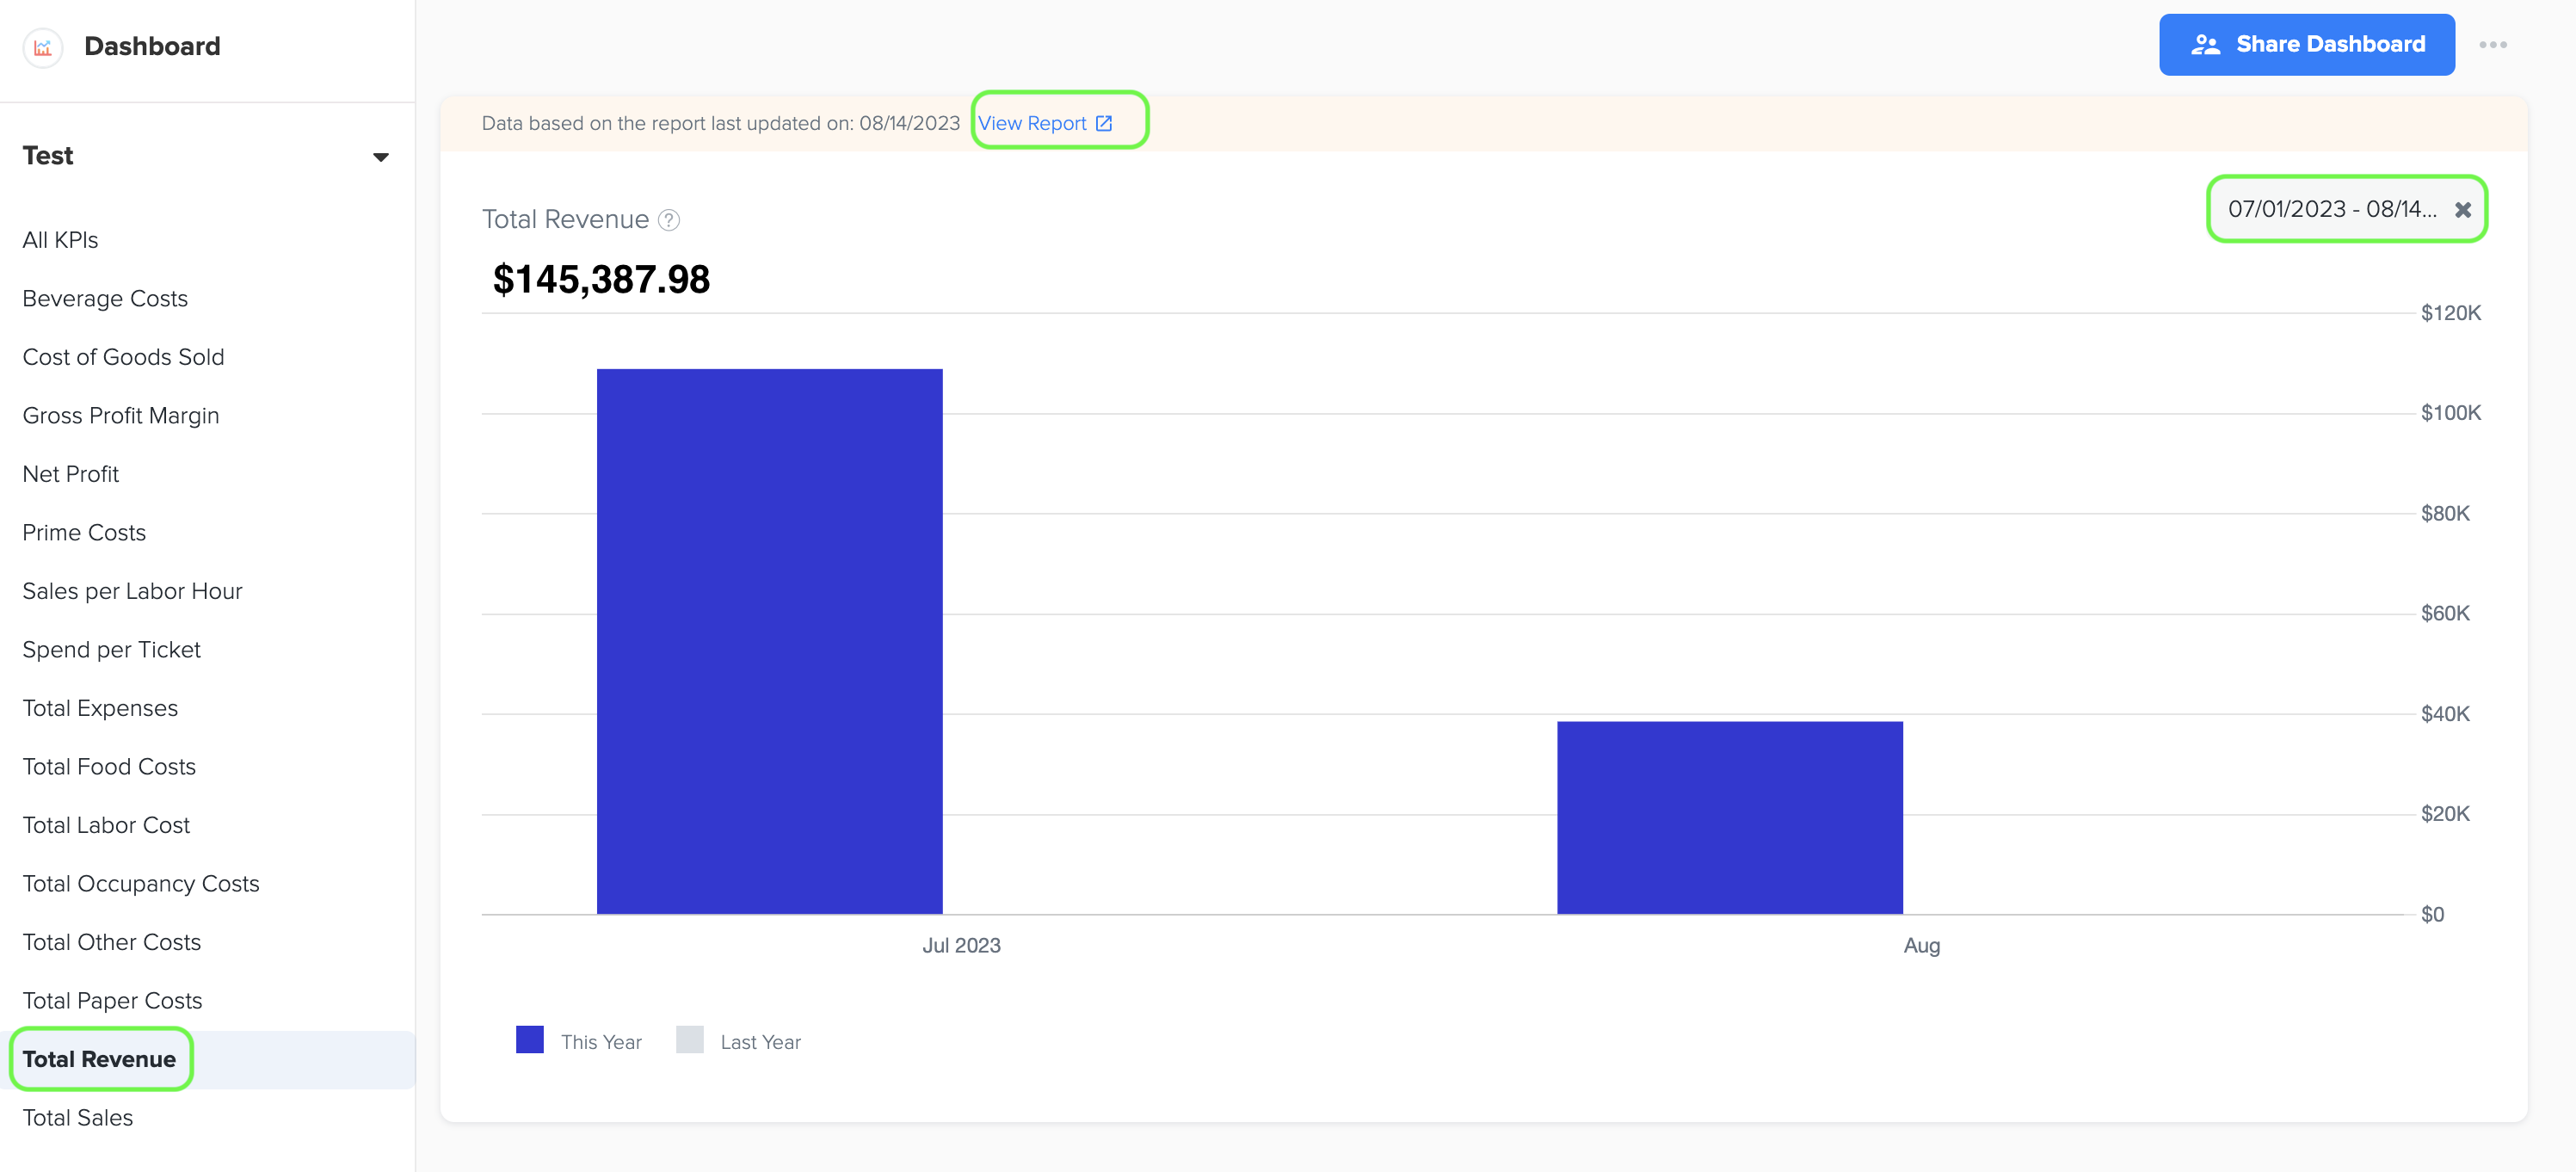
3. Total Revenue
1. Total revenue for a quick service restaurant business refers to the overall income generated from the sale of goods and services offered by the restaurant. It represents the total amount of money received from customers for the products or services provided.
In the context of a quick service restaurant, the sources of total revenue can include:
-
Food Sales: This includes the revenue generated from the sale of food items such as sandwiches, burgers, salads, sides, and other menu offerings.
-
Beverage Sales: This encompasses the revenue generated from the sale of beverages, including soft drinks, coffee, tea, juices, and other non-alcoholic beverages.
-
Combo Meals or Special Offers: Revenue earned from the sale of combo meals or special offers where multiple food items and beverages are bundled together at a discounted price.
-
Additional Menu Items: Revenue generated from the sale of additional menu items such as desserts, snacks, breakfast items, or any other supplementary offerings.
-
Takeout and Delivery Services: Revenue earned from takeout orders or delivery services, including any associated fees or charges.
-
Catering or Event Services: Revenue generated from providing catering services for events, parties, meetings, or other special occasions.
-
Other Revenue Streams: This includes any additional revenue sources specific to the quick service restaurant, such as vending machines, partnerships with third-party delivery services, merchandise sales, or licensing agreements.
2. To generate the bar graph, simply select the desired time period by choosing the start and end dates. Furthermore, while viewing the graph page, you have the option to click on the 'View Report' link. This will provide you with a detailed report and allow you to see the specific data source that was utilized to create the graph.
3. The data for this graph is obtained from the Total Income amount listed in the Profit and Loss statement, which can be accessed in the Basic menu under the Business Reports section of Docyt.
4. Gross Profit Margin (%)
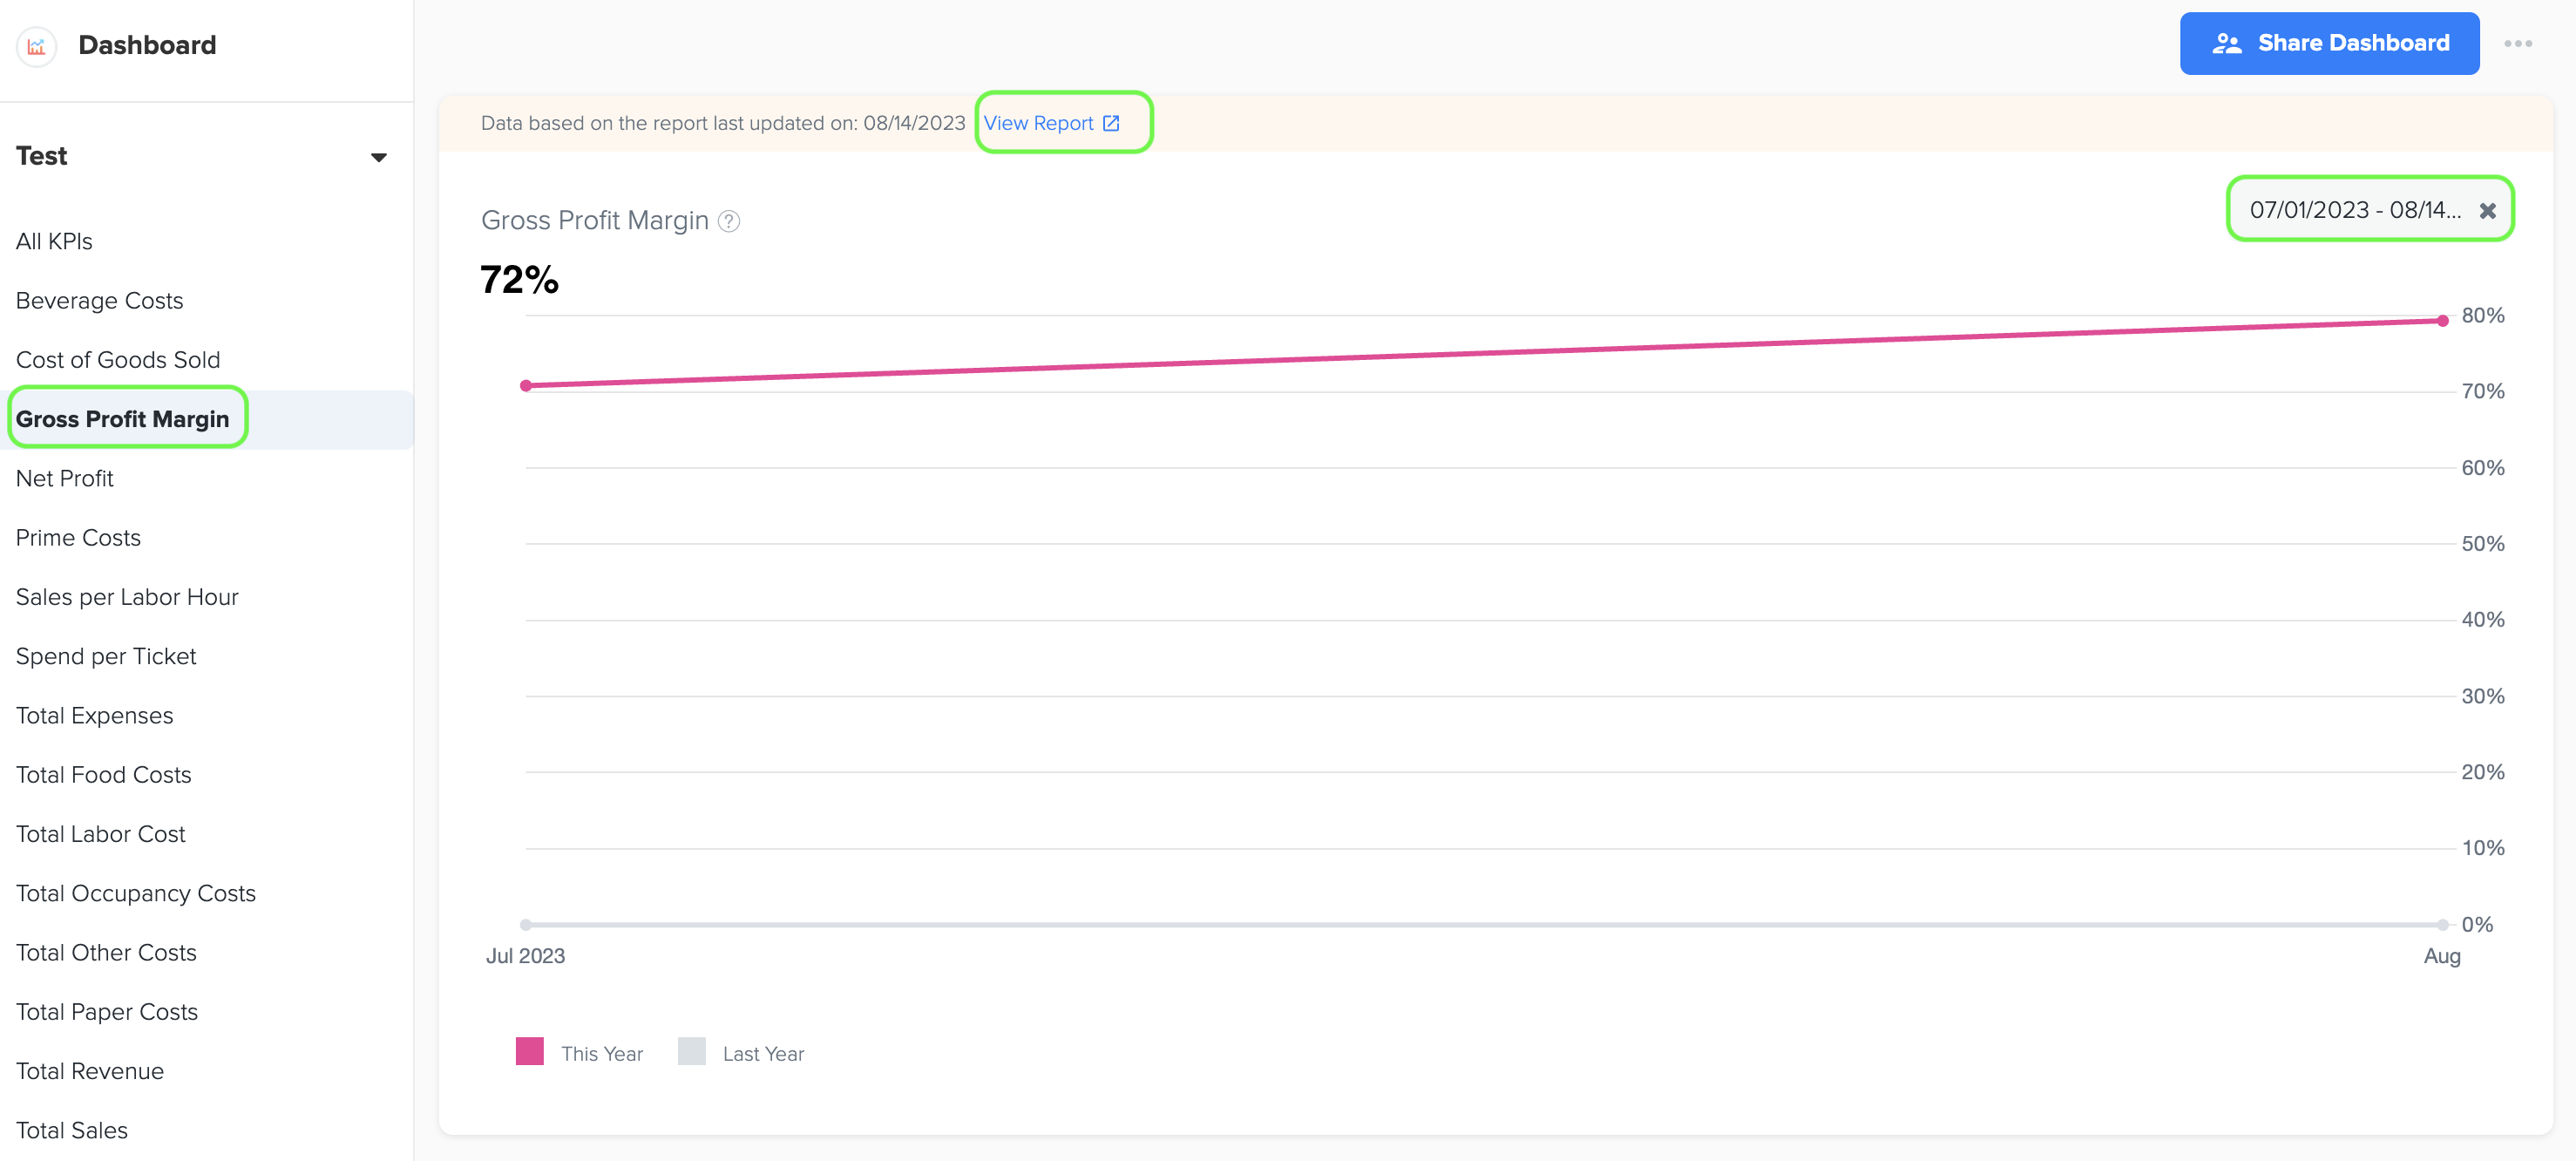
1. Gross profit margin, in the context of a quick service restaurant (QSR) business, is a financial metric that represents the percentage of revenue remaining after deducting the cost of goods sold (COGS) from total revenue. It measures the profitability of the restaurant's core operations and indicates how efficiently the business generates profit from its sales.
2. The formula for calculating gross profit margin is as follows:
Gross Profit Margin (%) = (Gross Profit / Total Revenue) x 100
where, Gross Profit=Total Revenue - Cost of Goods Sold
The components involved in the calculation are:
-
Total Revenue: This represents the overall income generated by the QSR from the sale of food, beverages, and other products or services.
-
Cost of Goods Sold (COGS): This includes the direct costs directly associated with producing or purchasing the food and beverages sold. It comprises expenses for ingredients, packaging materials, and other costs directly related to the production of items sold.
By subtracting the COGS from the total revenue and dividing the result by total revenue, the gross profit margin is obtained. Multiplying the result by 100 converts it to a percentage.
3. To generate the line graph, simply select the desired time period by choosing the start and end dates. Furthermore, while viewing the graph page, you have the option to click on the 'View Report' link. This will provide you with a detailed report and allow you to see the specific data source that was utilized to create the graph.
4. Data source for this line graph are Gross Profit (Loss) and Total Sales data in Owner's Report in Management Reports menu under Business Reports of Docyt.
5. Beverage Costs
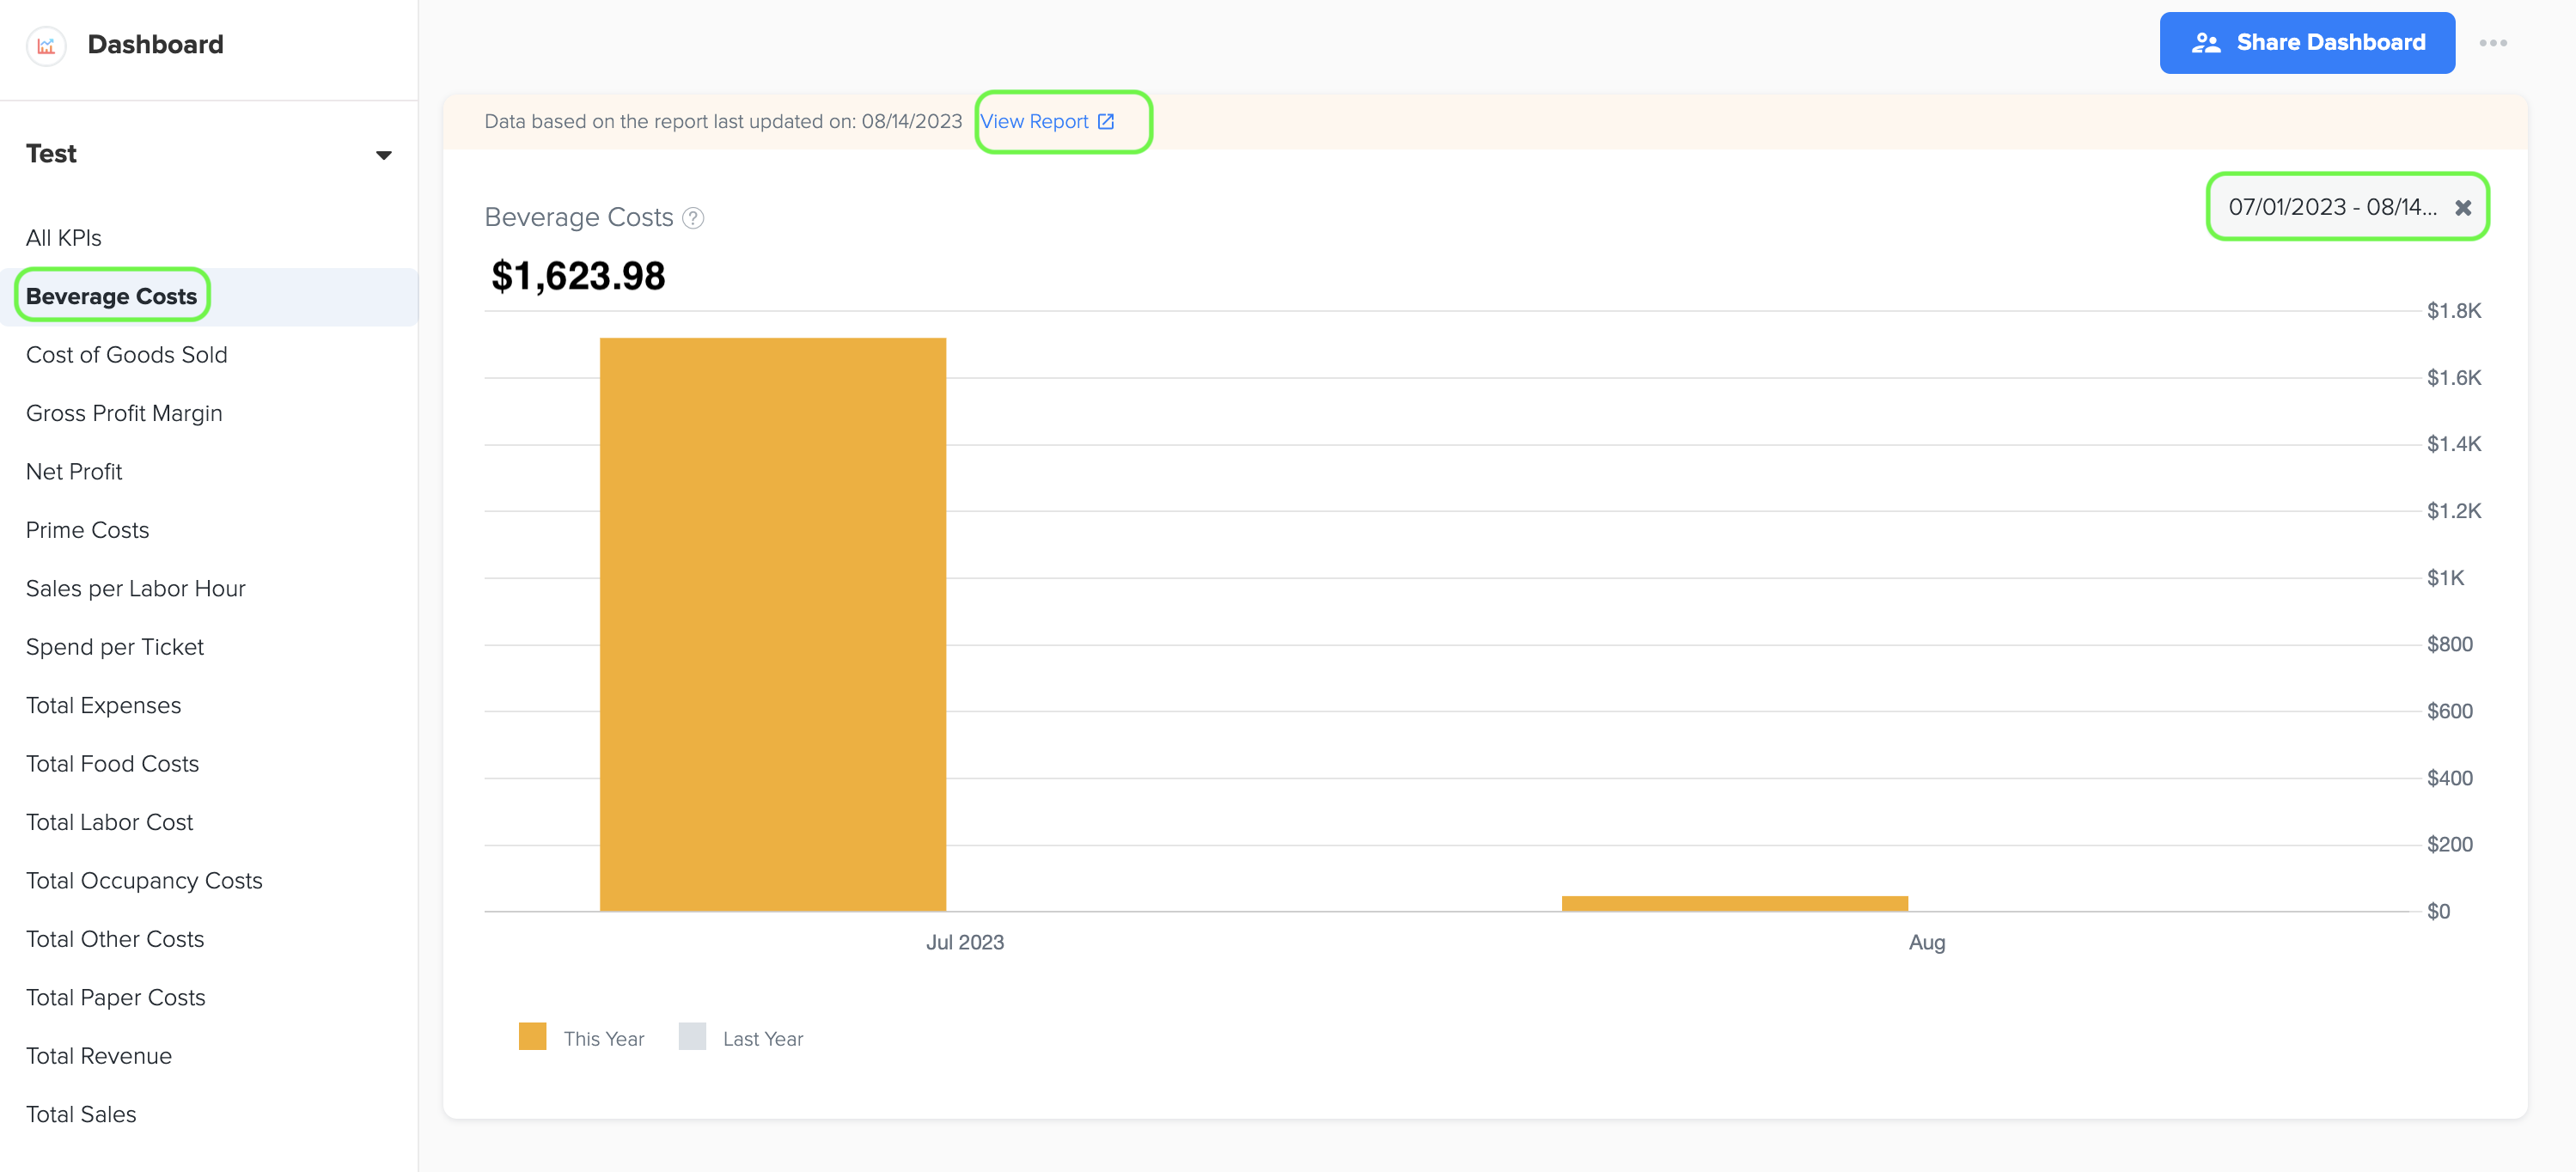
1. Beverage costs refer to the expenses incurred by a business for purchasing beverages, such as soft drinks, alcoholic beverages, juices, or coffee, which are offered to customers. It includes the cost of both alcoholic and non-alcoholic beverages, along with any associated supplies or ingredients used in beverage preparation.
2. To generate the graph, simply select the desired time period by choosing the start and end dates. Additionally, while viewing the graph page, you have the option to click on the 'View Report' link. This will provide you with a detailed report that shows the specific data source that was used to create the graph.
3. The data for this graph is obtained from Cost of Goods Sold- Beverage in Owners report under management report.
6. Cost of Goods Sold
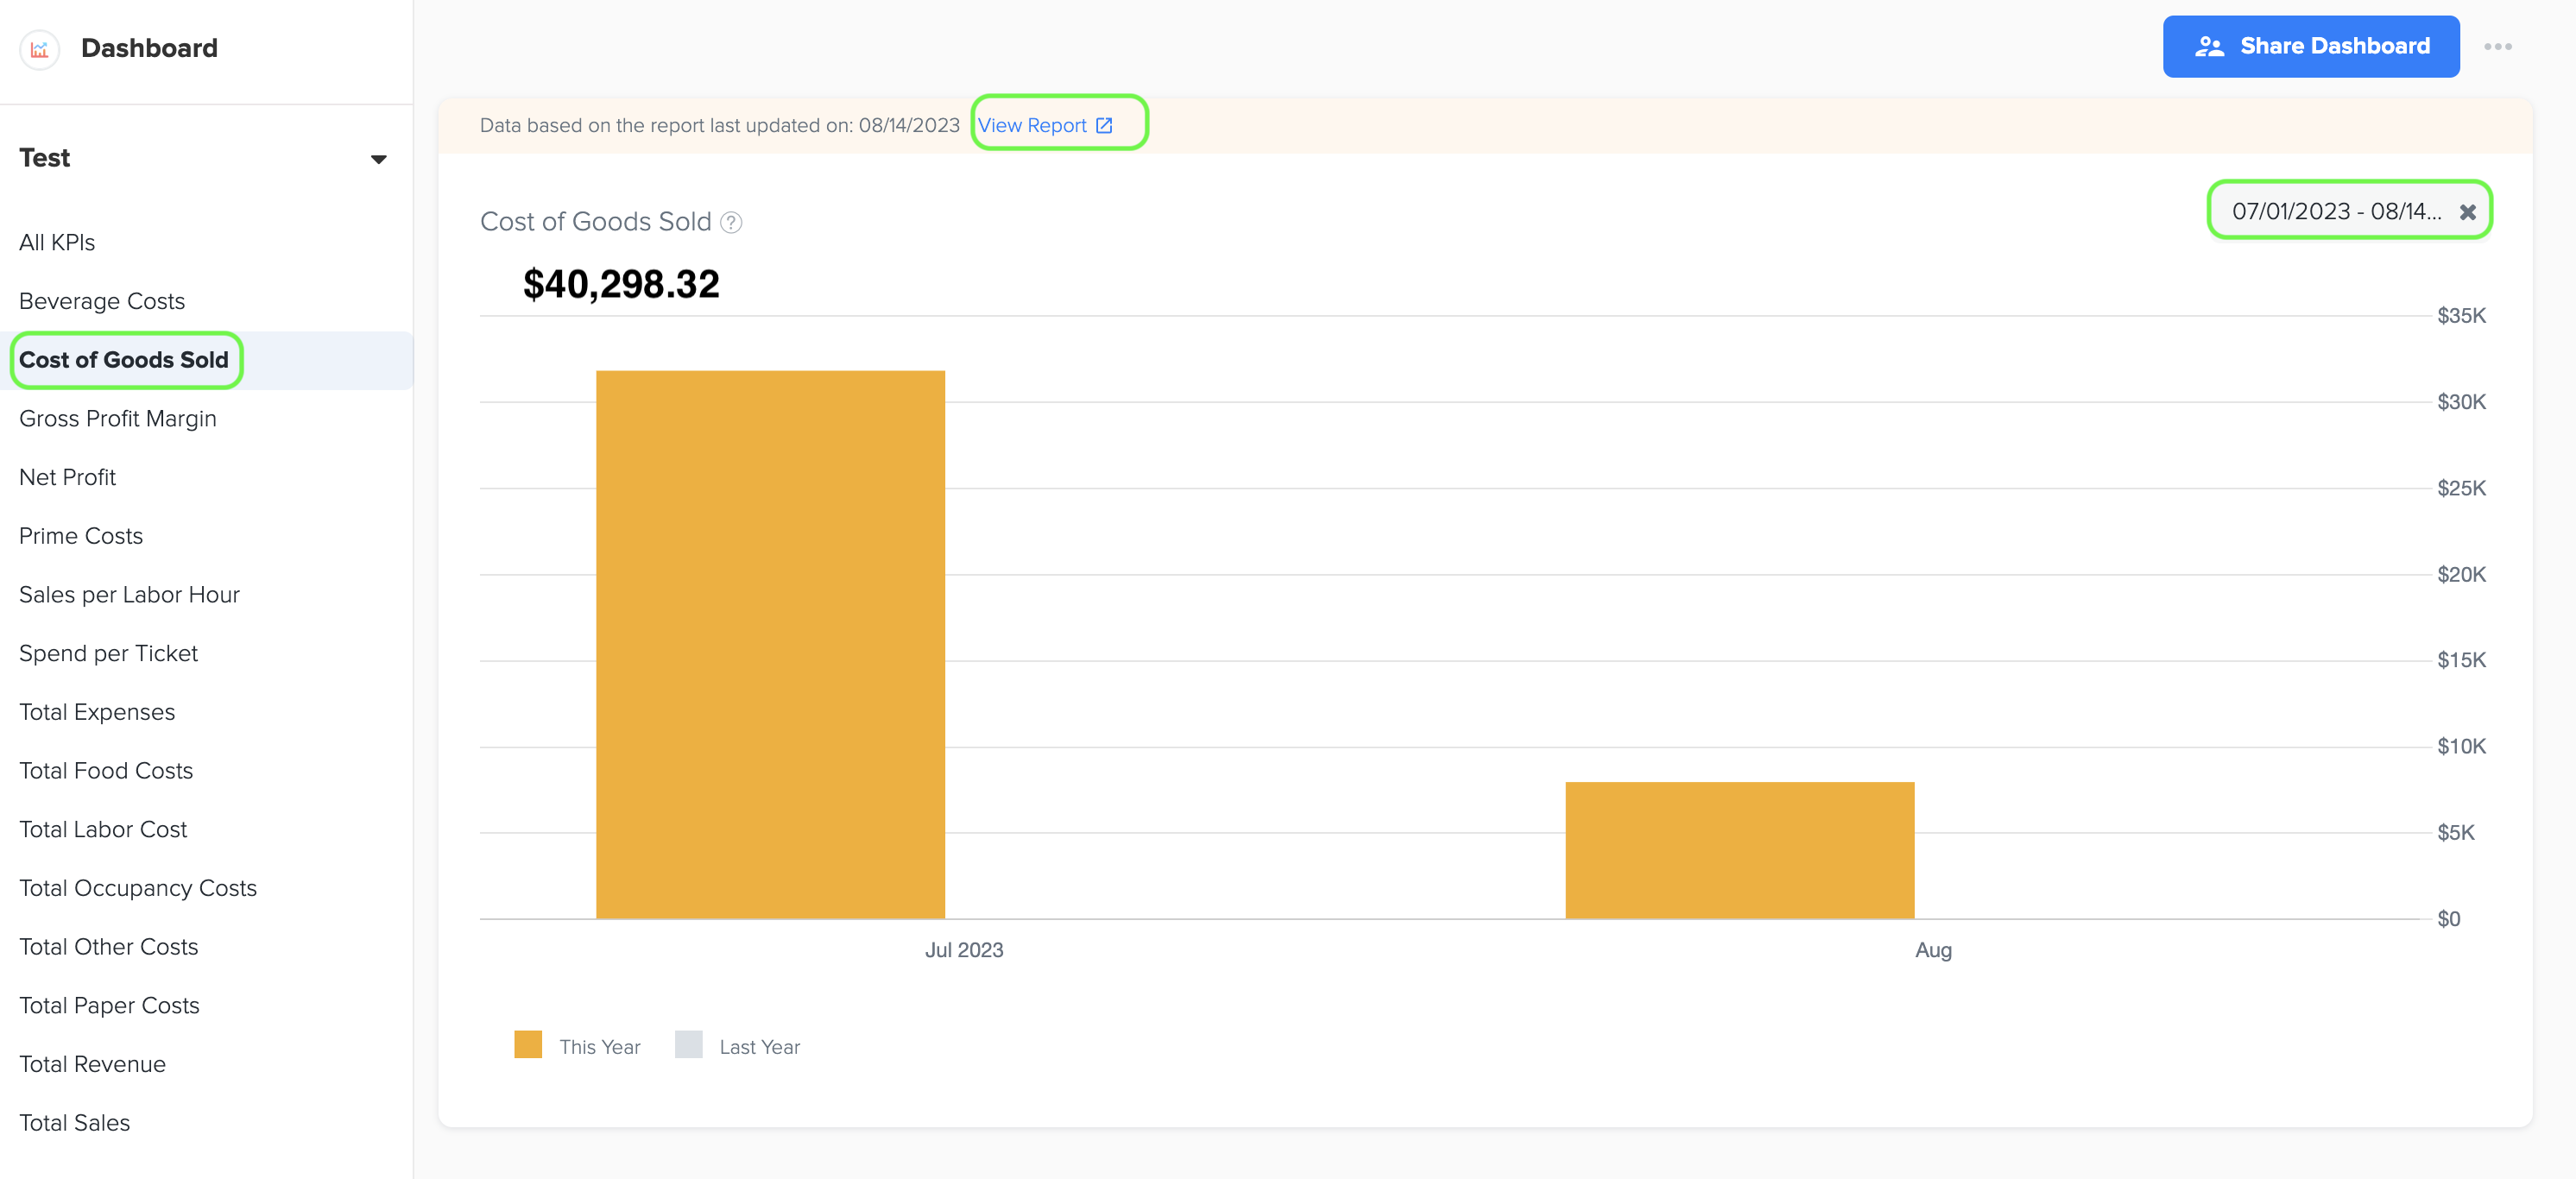
1. Cost of Goods Sold (COGS) refers to the total direct costs incurred by a restaurant to produce the food and beverages it sells. These costs include ingredients, packaging, and any other materials directly related to the creation of the menu items. It is the sum total of COGS for Food, Paper, and Beverage.
2. To generate the graph, simply select the desired time period by choosing the start and end dates. Additionally, while viewing the graph page, you have the option to click on the 'View Report' link. This will provide you with a detailed report that shows the specific data source that was used to create the graph.
3. The data for this graph is obtained from Total Cost of Goods Sold in QSR Owners report under Management report.
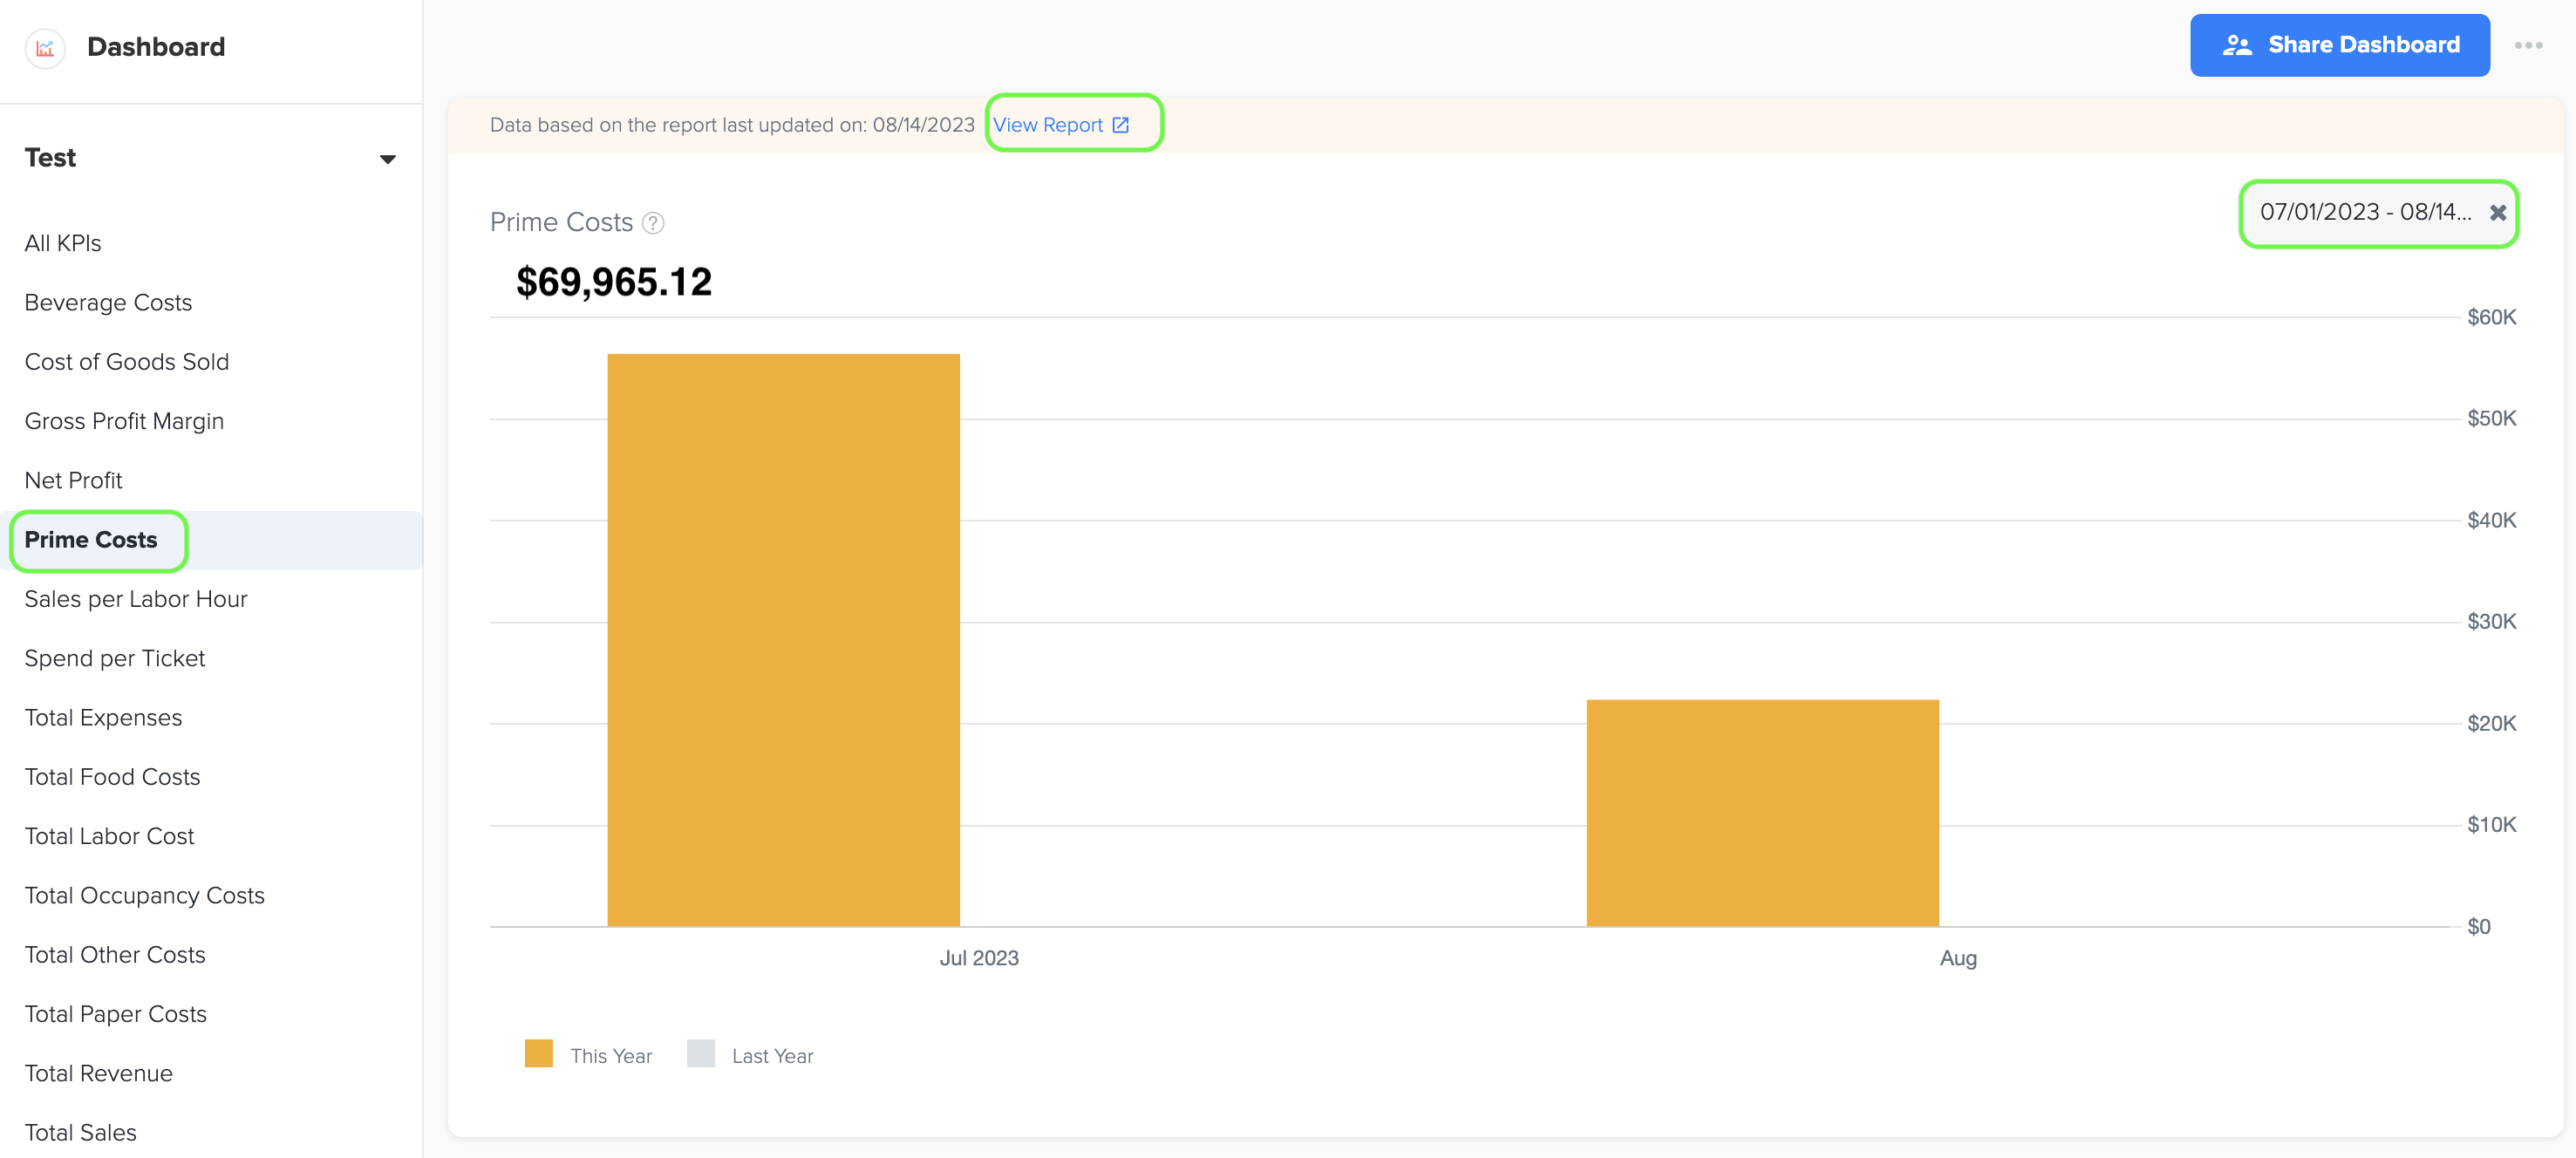
7. Prime Costs
1. Prime Costs represent the direct costs directly tied to the production or creation of goods or services, typically including the cost of labor and the cost of raw materials or components used in the manufacturing or service delivery process.
2. To generate the graph, simply select the desired time period by choosing the start and end dates. Additionally, while viewing the graph page, you have the option to click on the 'View Report' link. This will provide you with a detailed report that shows the specific data source that was used to create the graph.
3. The data for this graph is obtained from Prime Cost (COGS+Labor) in QSR Owners Report under Management Report.
8. Sales per Labor Hour
1. Sales per Labor Hour is a performance metric that calculates the revenue generated by a business for each hour worked by its employees, providing insights into the productivity and efficiency of labor utilization in driving sales.
2. Its formula is:
Sales/Labor Hour= Total Sales Revenue/ Total Labor Hour
3. To generate the graph, simply select the desired time period by choosing the start and end dates. Additionally, while viewing the graph page, you have the option to click on the 'View Report' link. This will provide you with a detailed report that shows the specific data source that was used to create the graph.
4. The data for this graph is obtained from Total Sales in Owners report and Labor Hours in Industry Metrics.
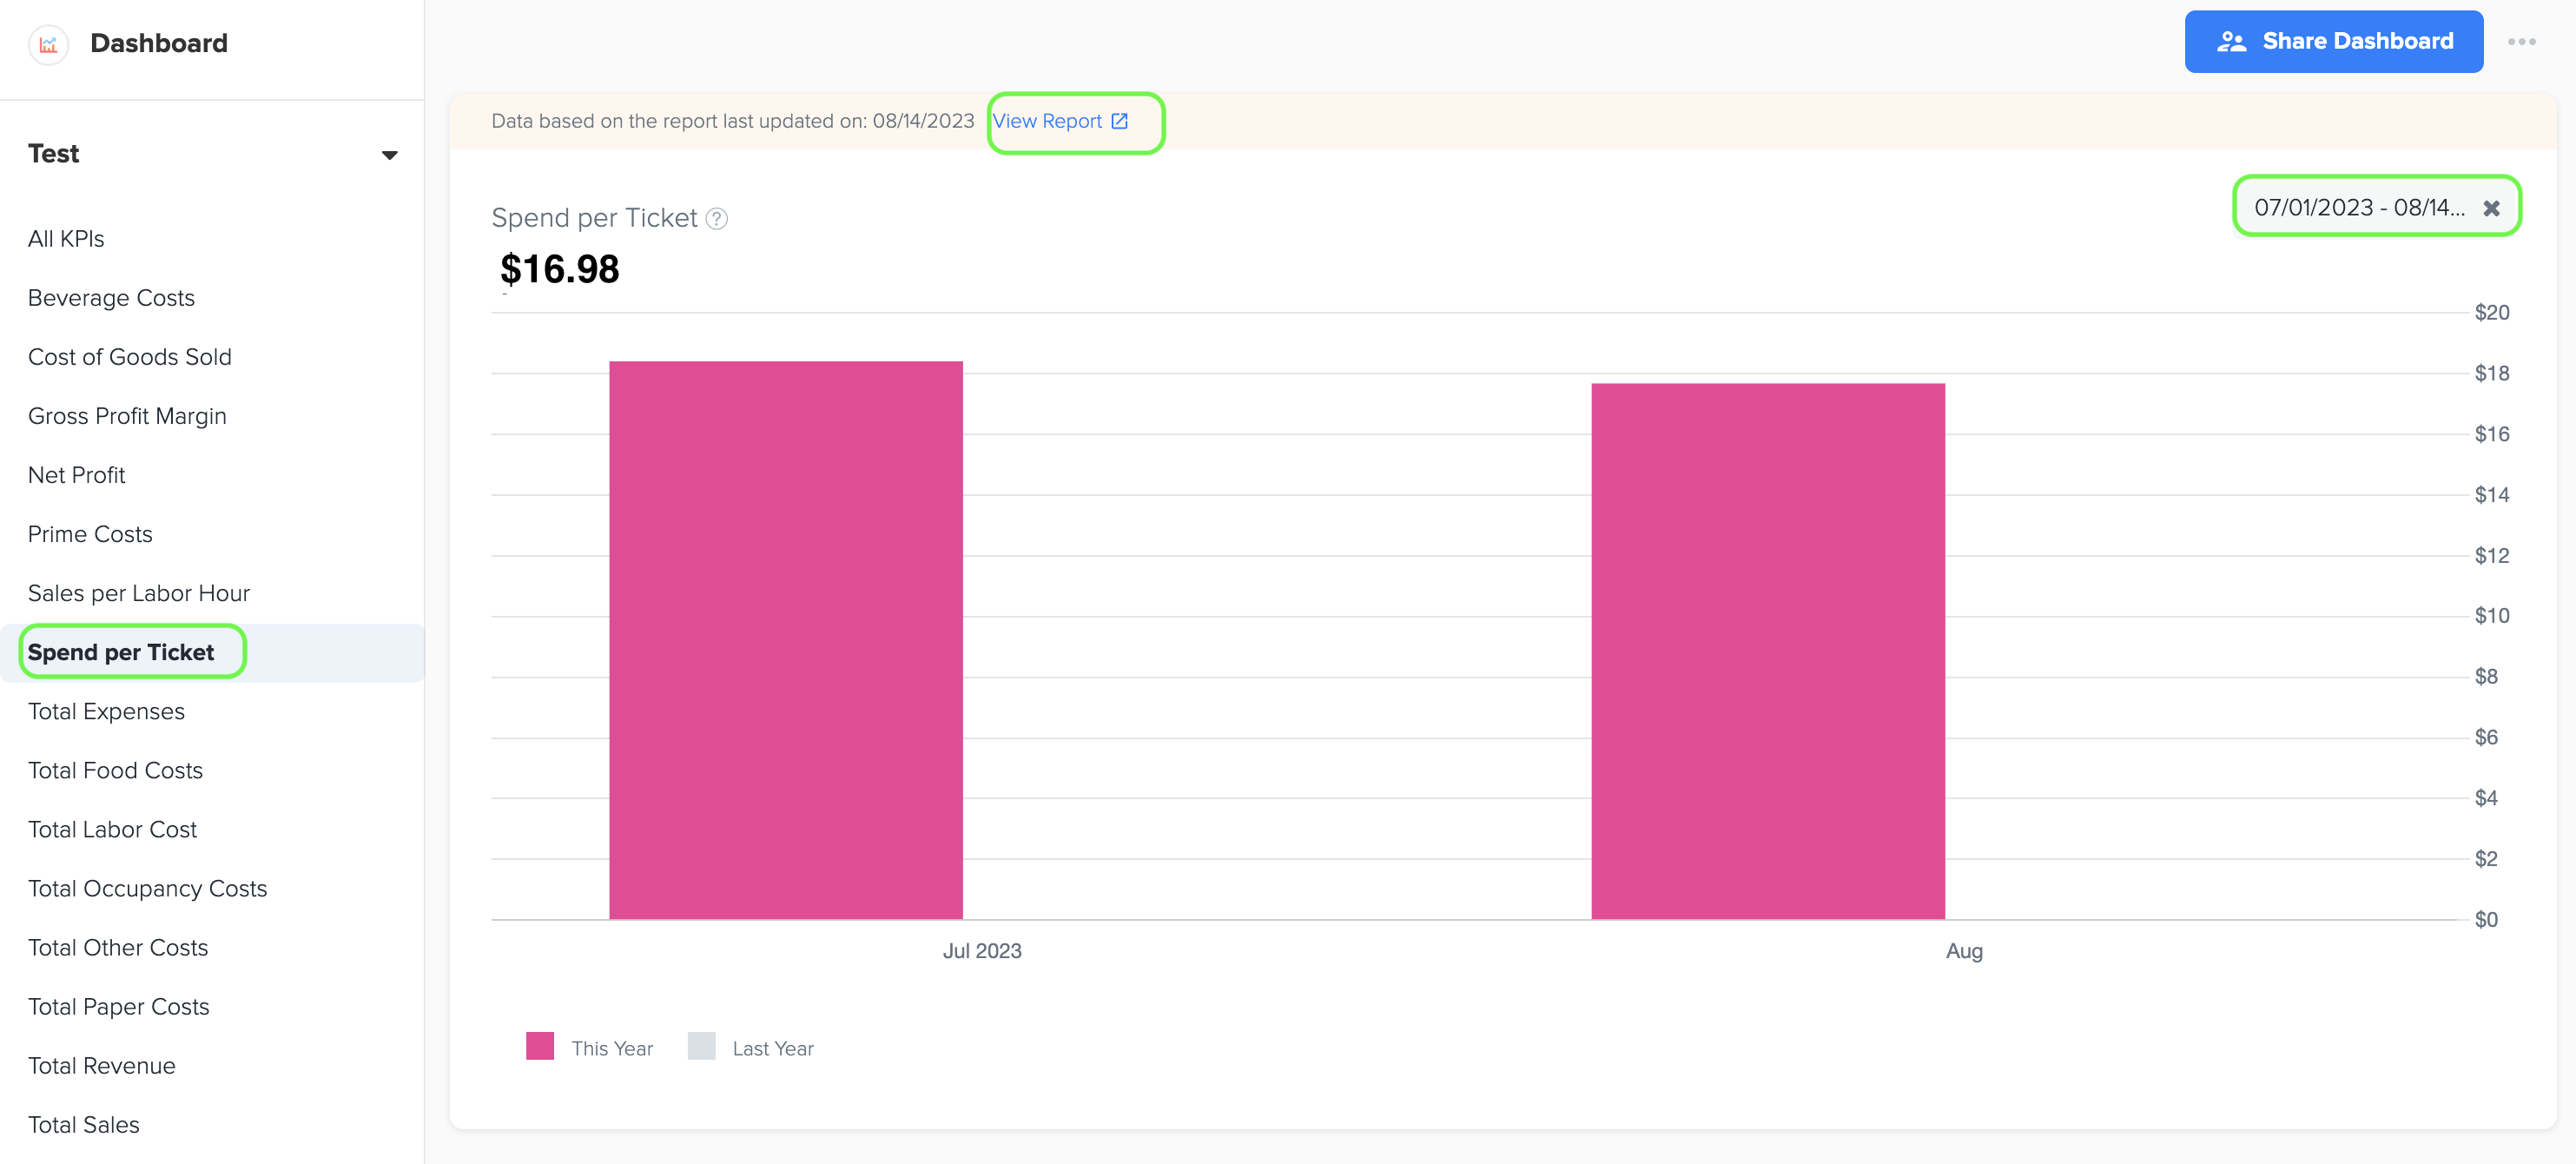
9. Spend per Ticket
1. Spend per ticket represents the average expenditure made by customers during each transaction at a restaurant, giving insight into the typical value of each customer's order.
2. To generate the graph, simply select the desired time period by choosing the start and end dates. Additionally, while viewing the graph page, you have the option to click on the 'View Report' link. This will provide you with a detailed report that shows the specific data source that was used to create the graph.
3. The data for this graph is obtained from Total Sales in Owner’s Report and Number of Tickets in Industry Metrics.
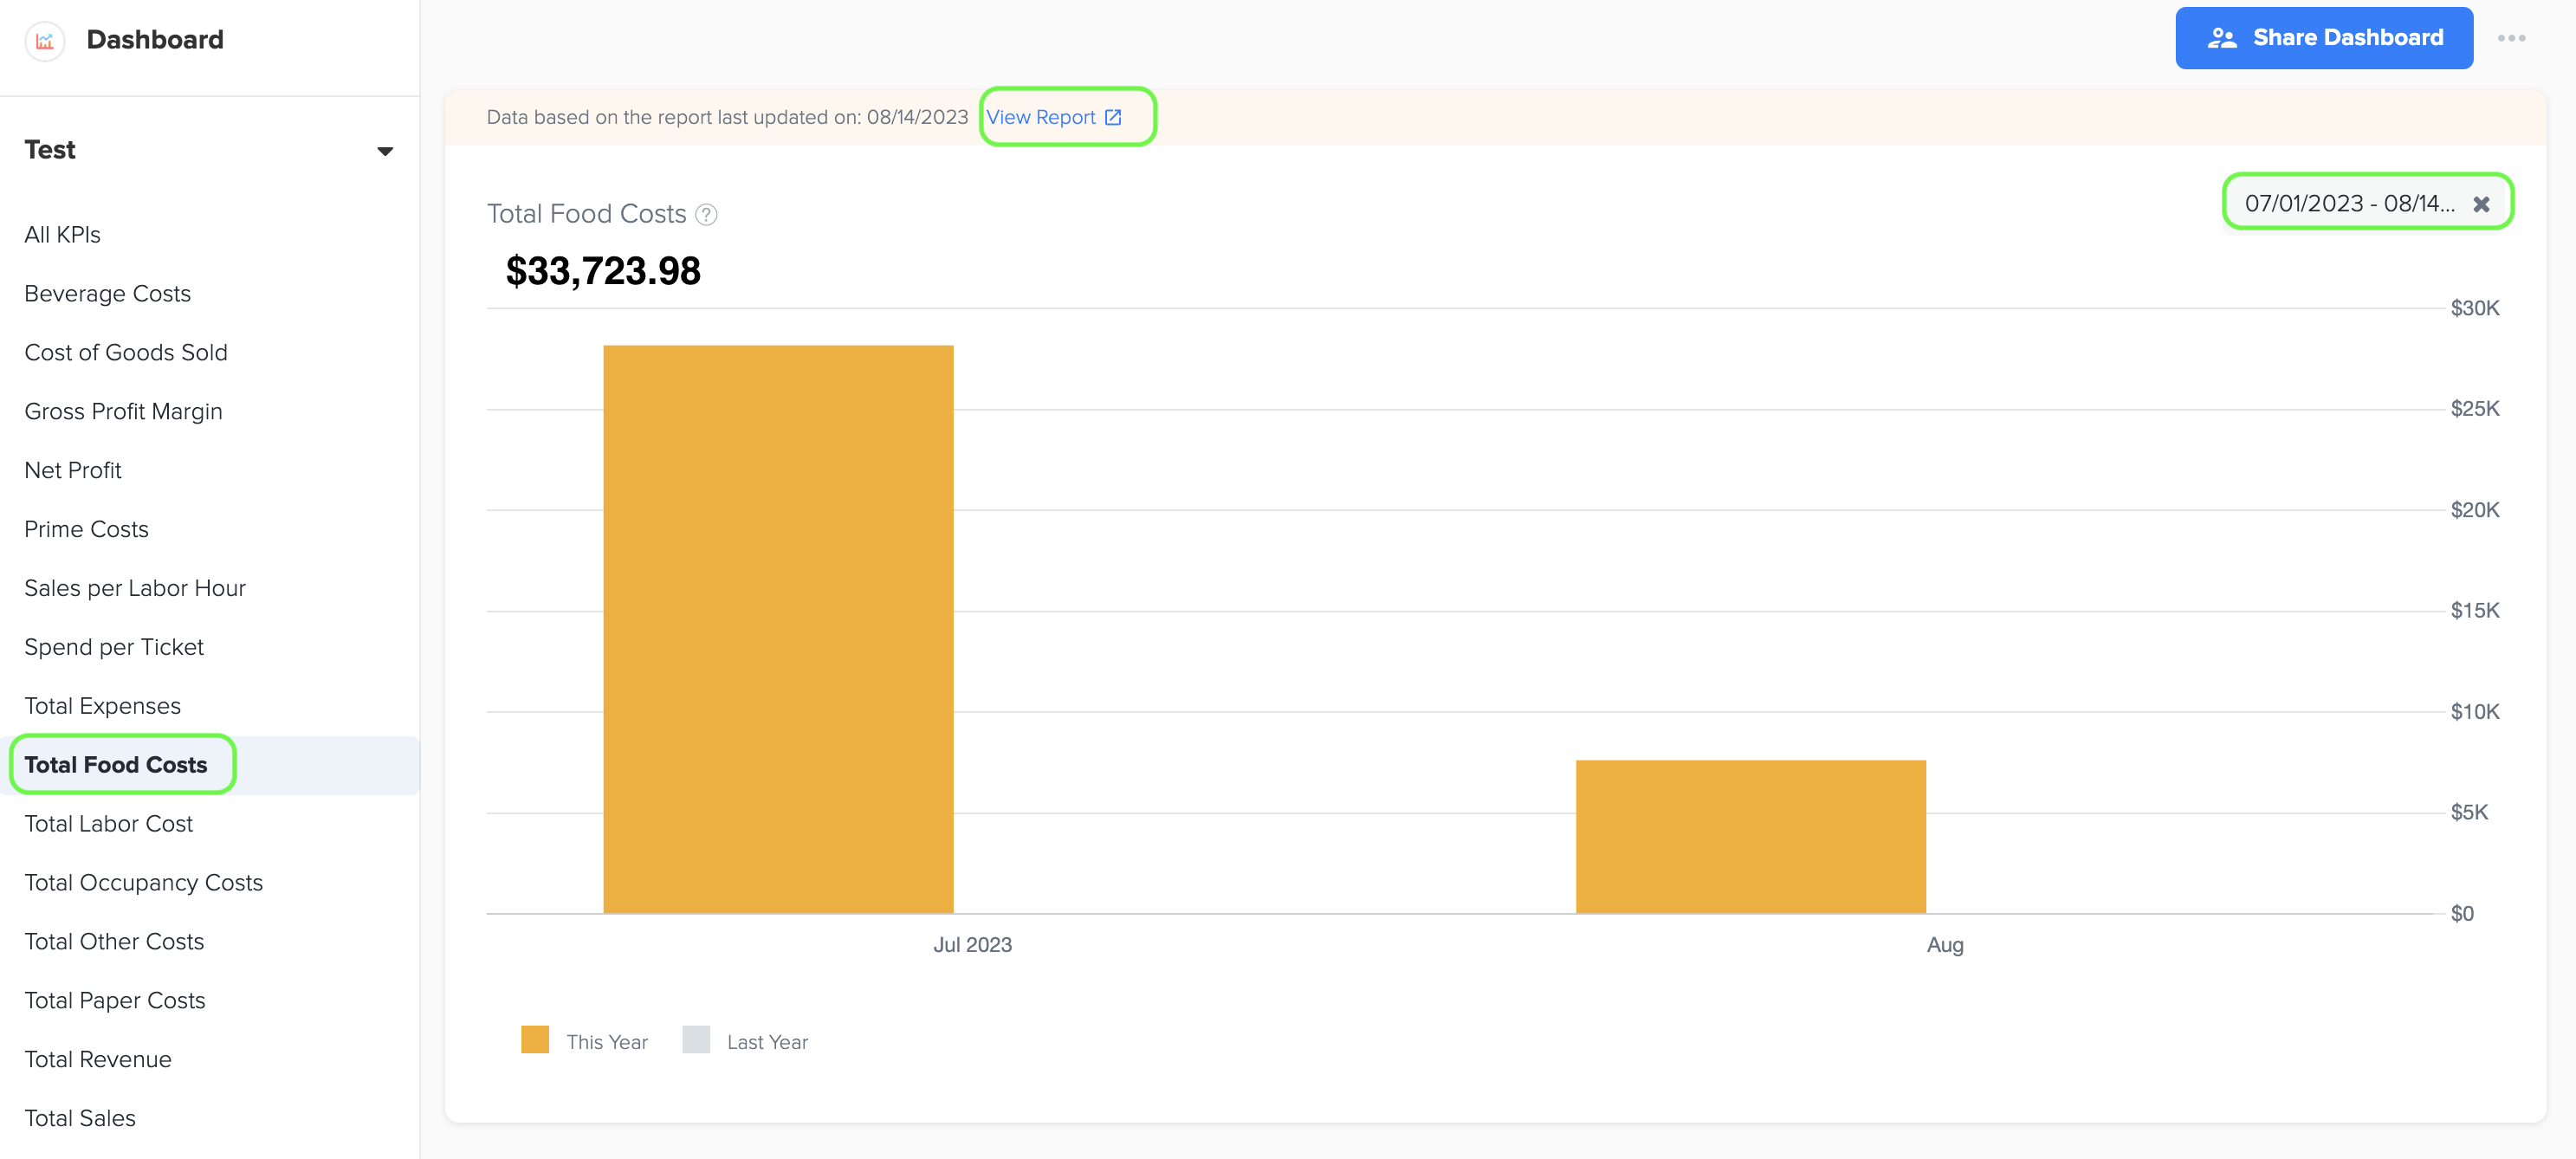
10. Total Food Costs
1. Total Food costs represent the expenses associated with the purchase of food ingredients and supplies used in the preparation of menu items by a restaurant or food establishment. It includes the cost of raw materials, ingredients, and any additional costs directly related to food production.
2. To generate the graph, simply select the desired time period by choosing the start and end dates. Additionally, while viewing the graph page, you have the option to click on the 'View Report' link. This will provide you with a detailed report that shows the specific data source that was used to create the graph.
3. The data for this graph is obtained from Cost of Goods Sold - Food in owners report under management report.
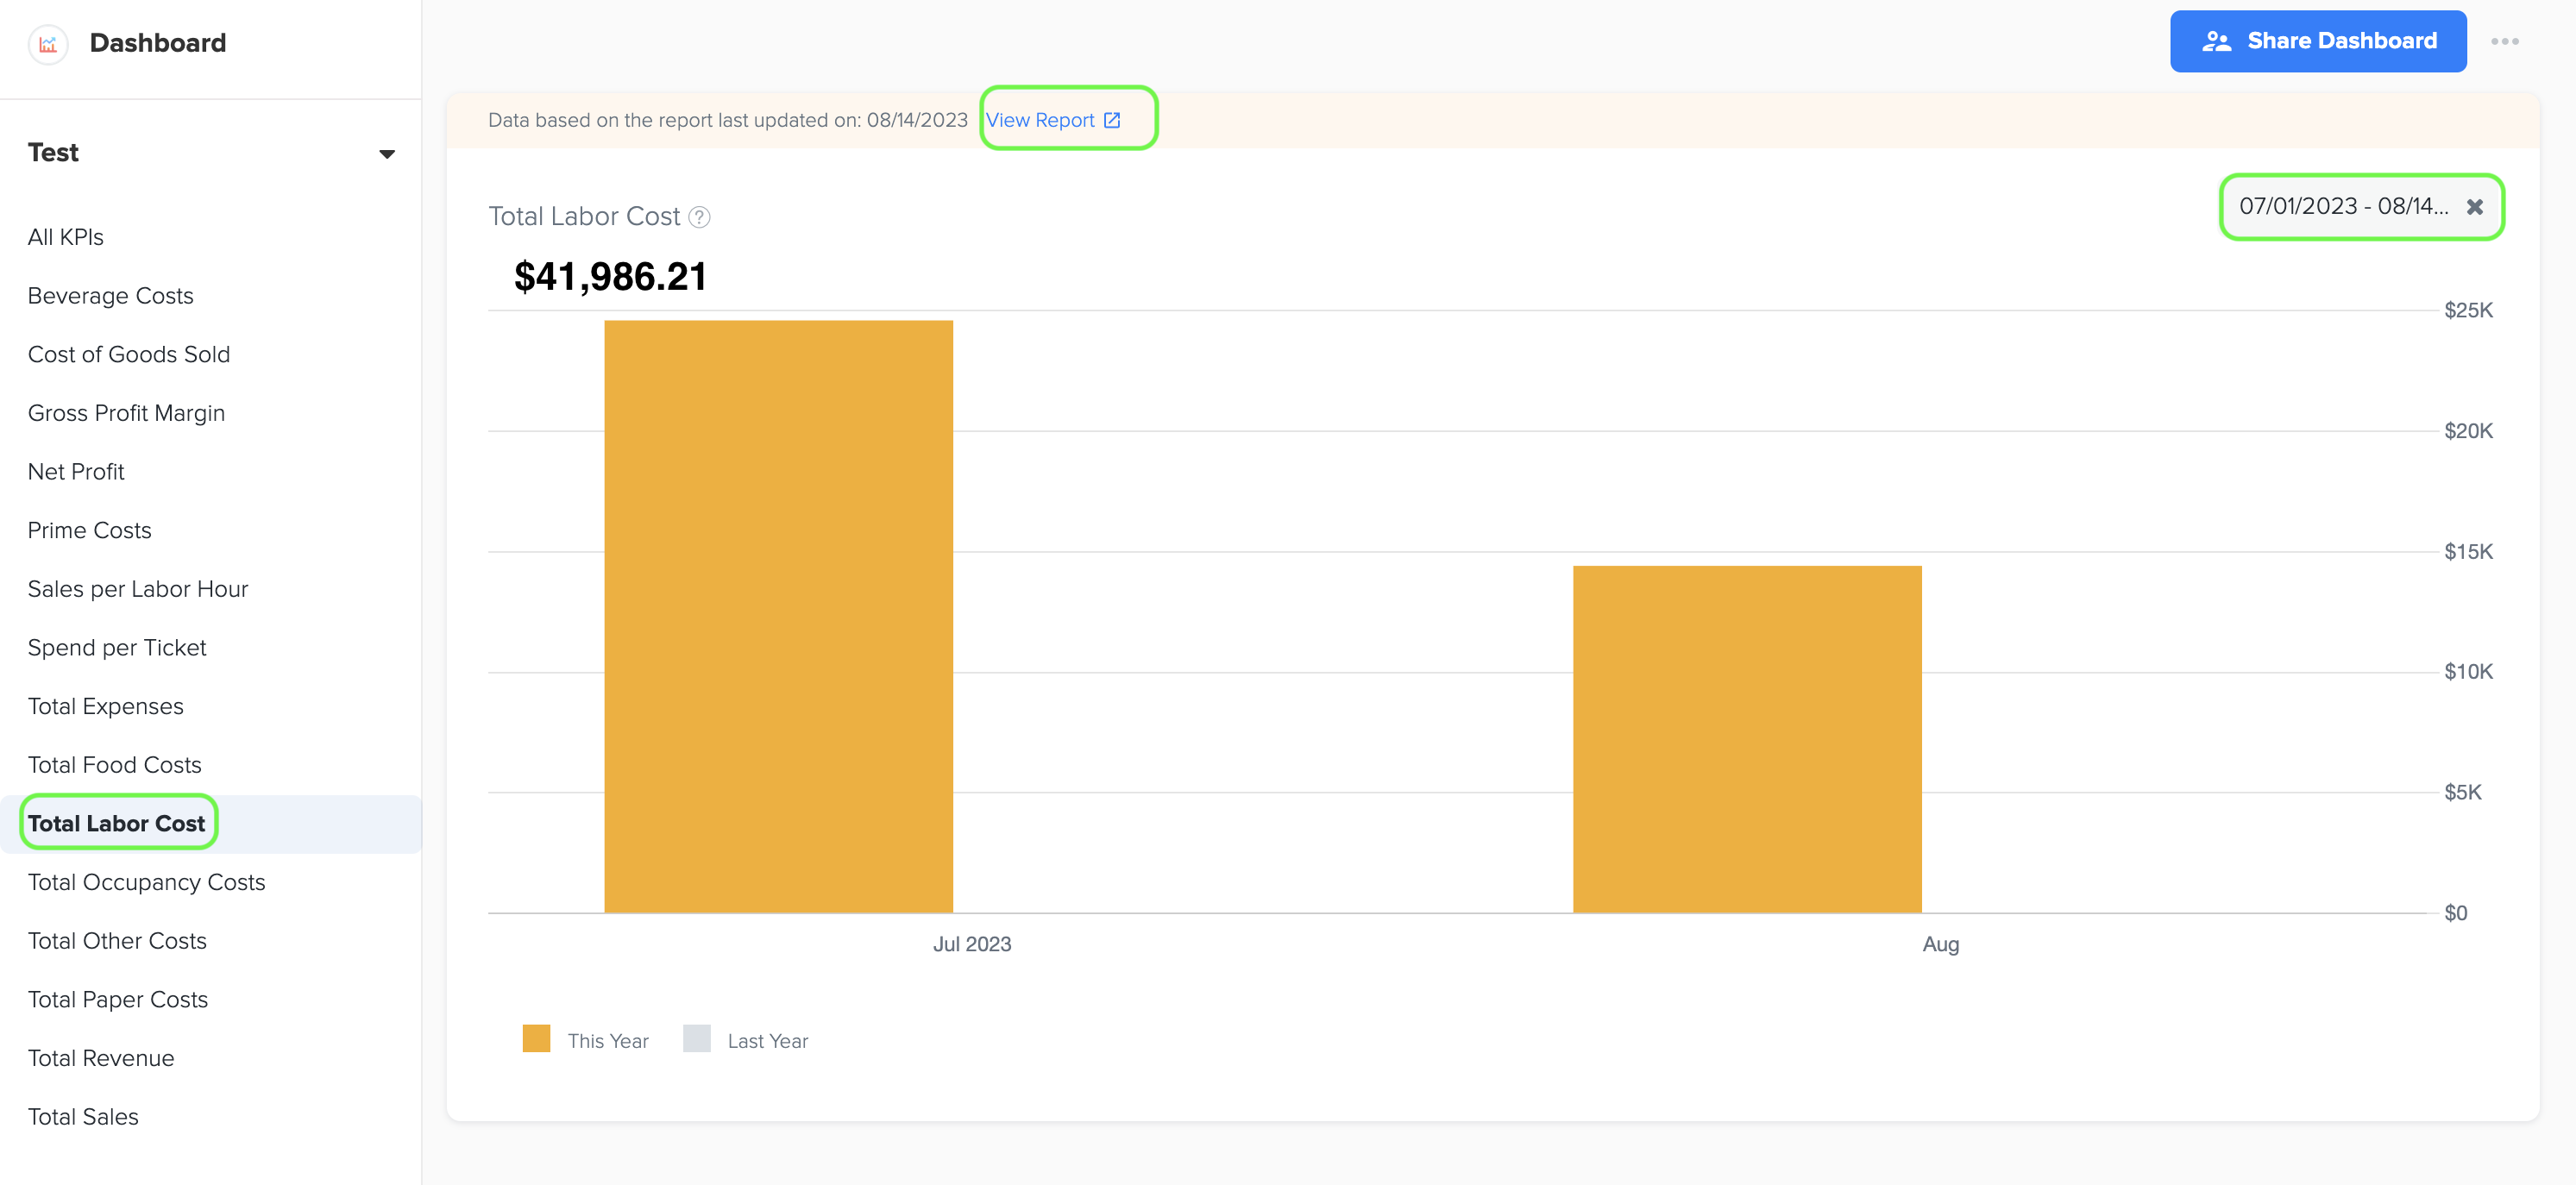
11. Total Labor Cost
1. Total labor costs include all the expenses related to employee wages, benefits, and payroll taxes that a business incurs.
2. To generate the graph, simply select the desired time period by choosing the start and end dates. Additionally, while viewing the graph page, you have the option to click on the 'View Report' link. This will provide you with a detailed report that shows the specific data source that was used to create the graph.
3. The data for this graph is obtained from Total Labor Cost in owners report under management report.
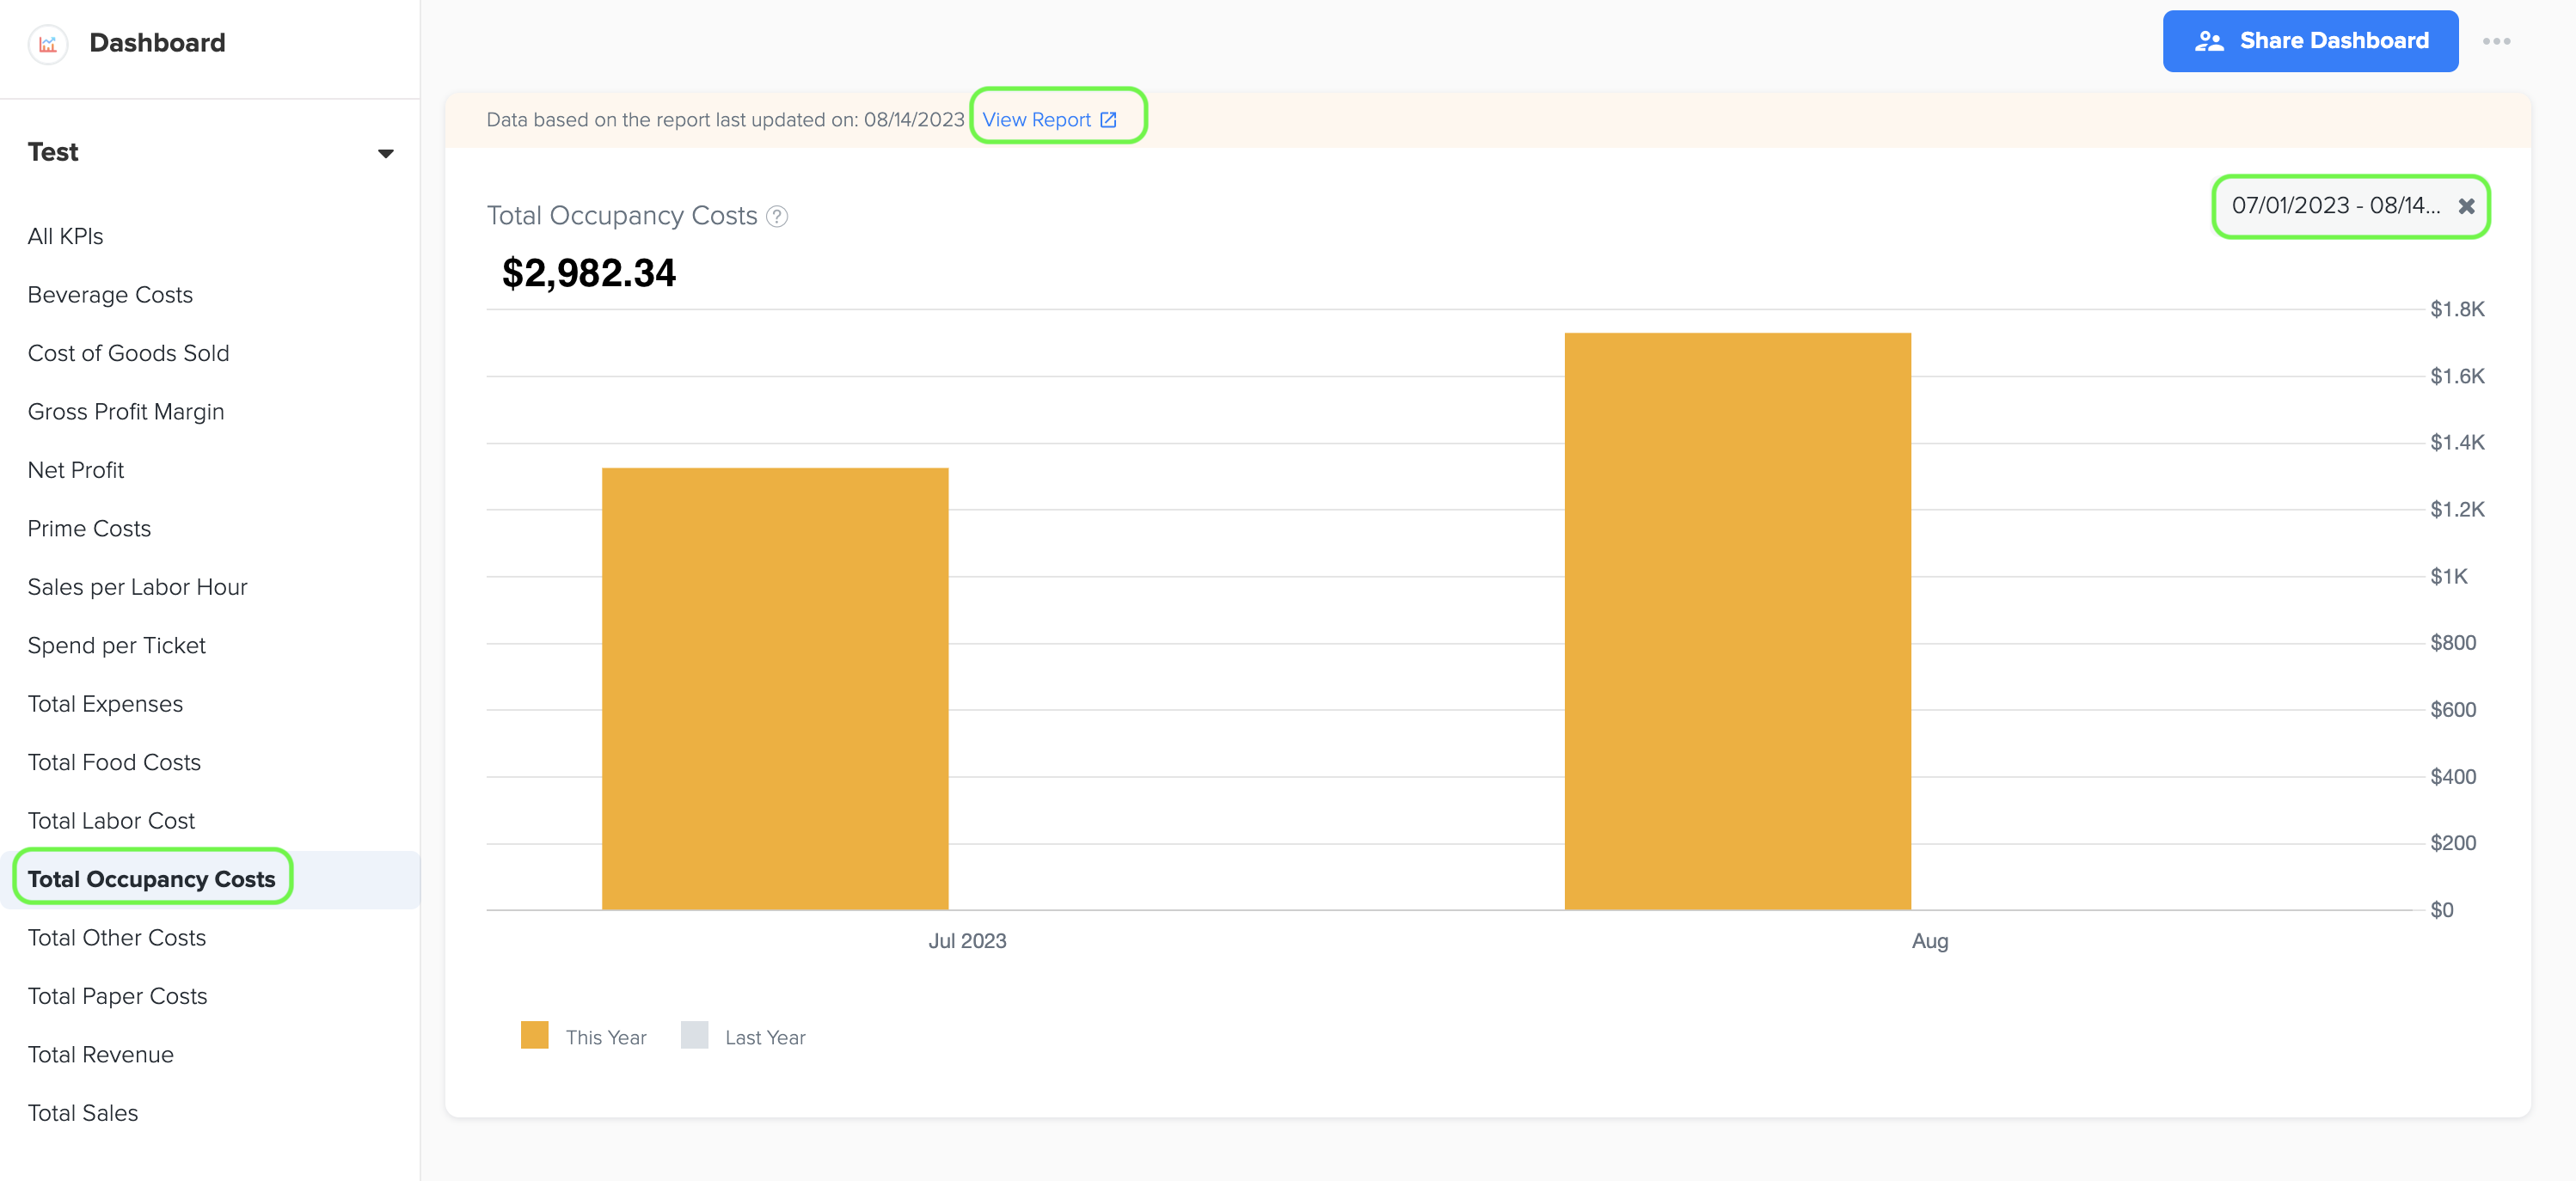
12. Total Occupancy Costs
1. Total occupancy costs represent the sum of expenses associated with occupying and maintaining a business space, including rent, utilities, property taxes, and maintenance fees.
2. To generate the graph, simply select the desired time period by choosing the start and end dates. Additionally, while viewing the graph page, you have the option to click on the 'View Report' link. This will provide you with a detailed report that shows the specific data source that was used to create the graph.
3. The data for this graph is obtained from Total Occupancy Costs in Owners Report under Management Report.
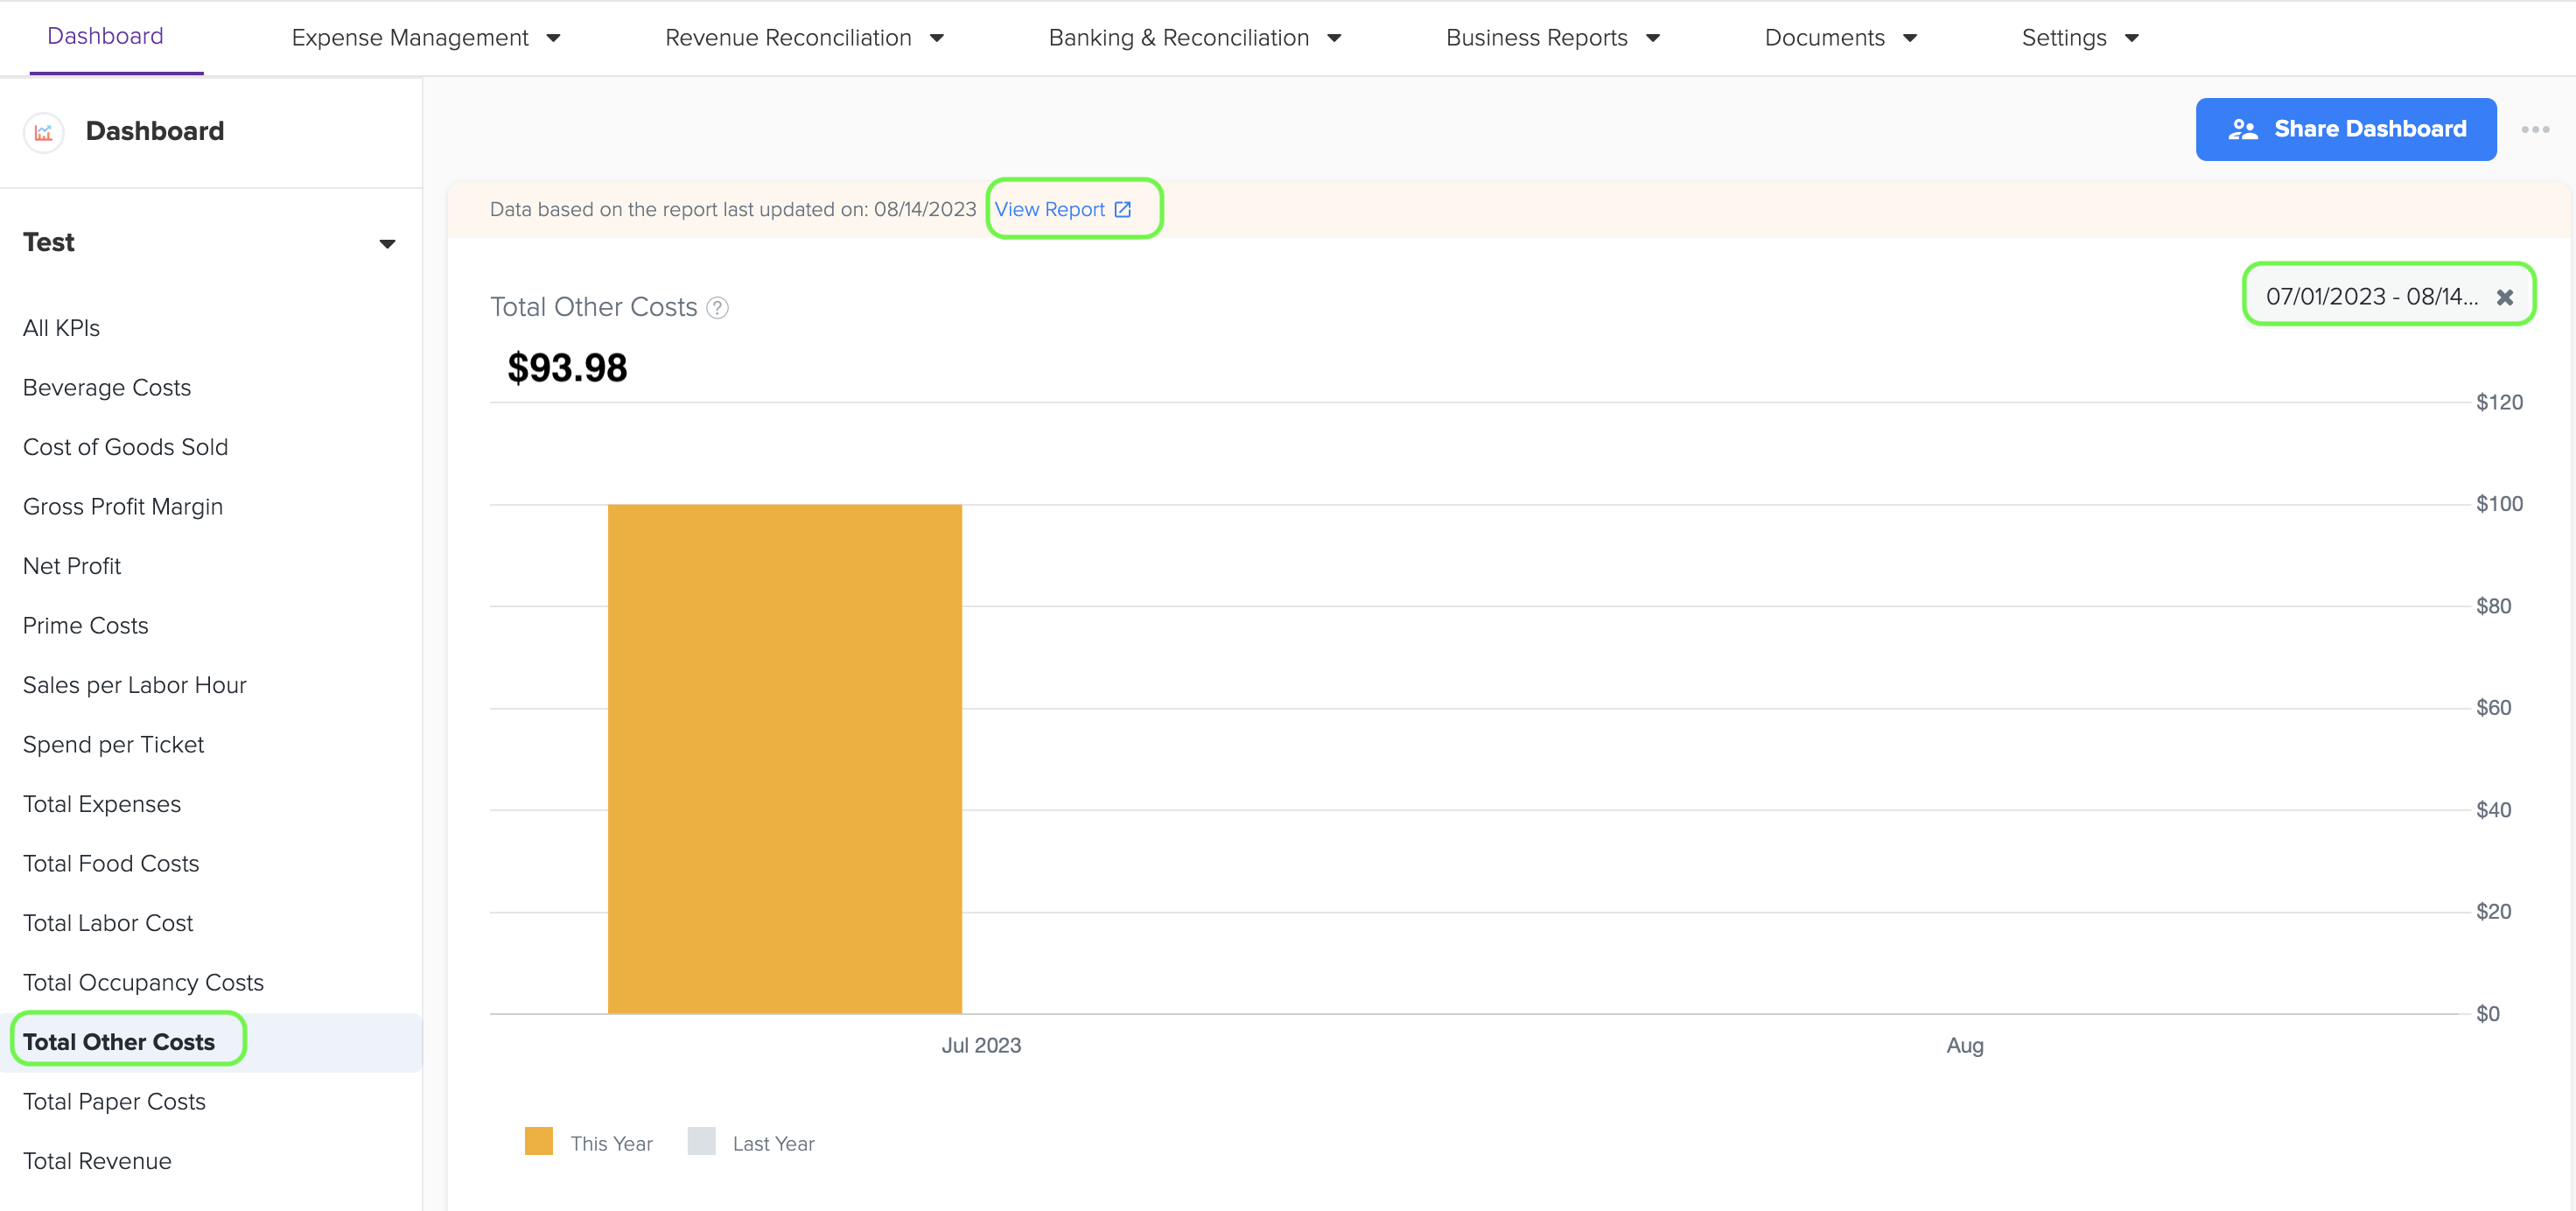
13. Total Other Costs
1. Total other costs refer to the collective expenses incurred by a business that do not fall under the categories of labor, food, paper, operational costs, or beverage costs. An example of these costs can be interest expenses.
2. To generate the graph, simply select the desired time period by choosing the start and end dates. Additionally, while viewing the graph page, you have the option to click on the 'View Report' link. This will provide you with a detailed report that shows the specific data source that was used to create the graph.
3. The data for this graph is obtained from Total Other Costs in QSR Owners Report under Management Report.
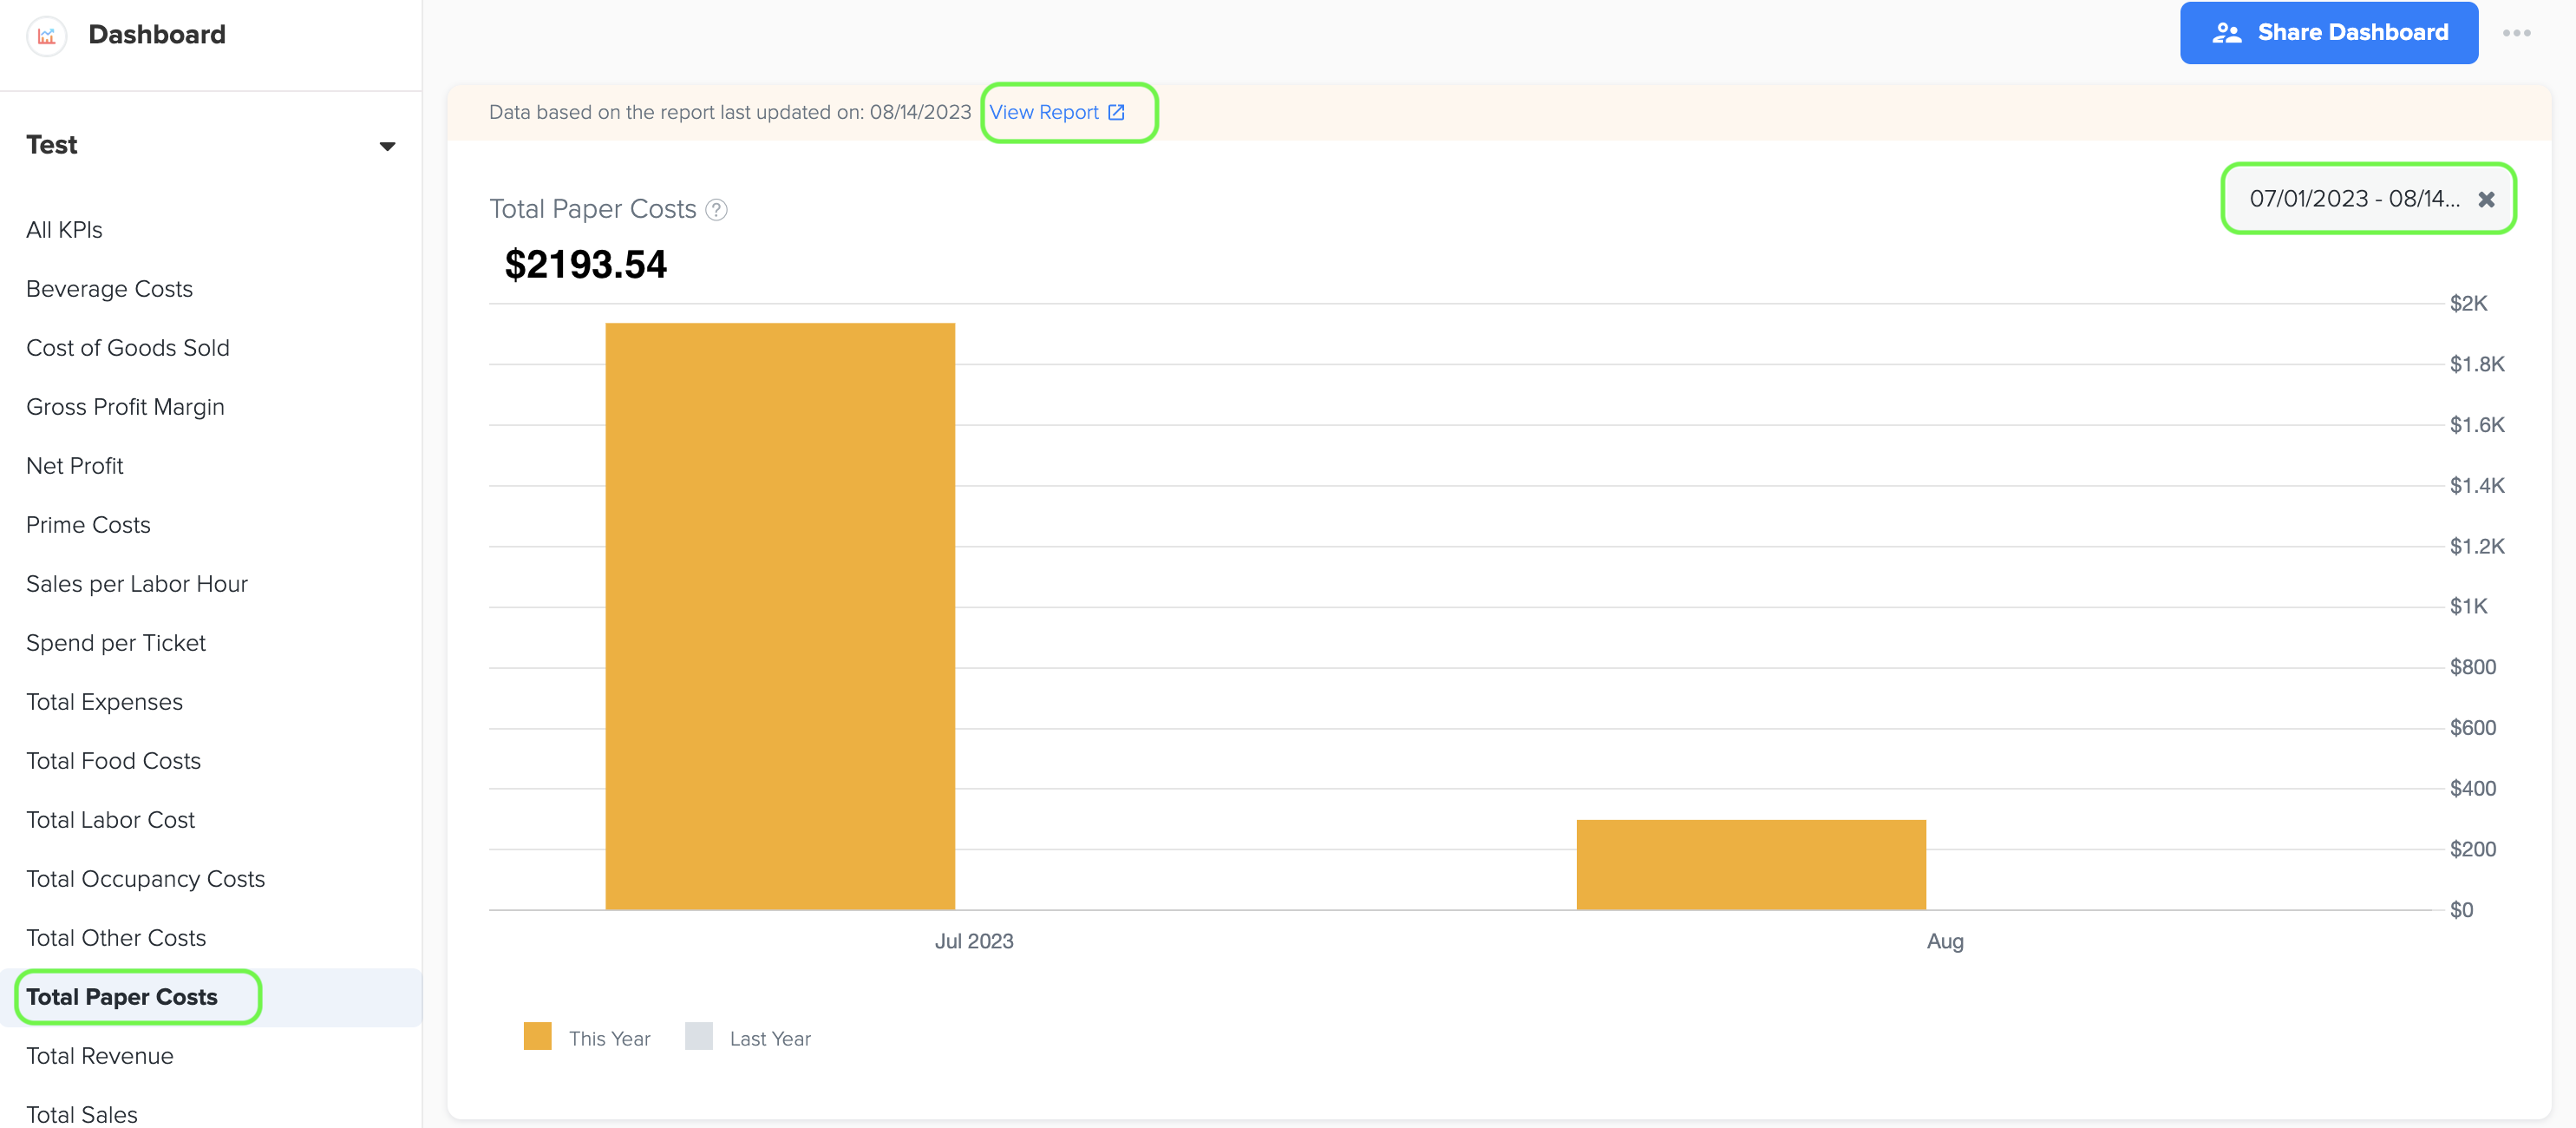
14. Total Paper Costs
1. Paper costs include the expenditures associated with buying paper products and supplies used in a business, such as napkins, menus, paper towels, packaging materials, and other disposable items. These costs represent the expenses involved in ensuring an adequate supply of paper-based goods for day-to-day operations.
2. To generate the graph, simply select the desired time period by choosing the start and end dates. Additionally, while viewing the graph page, you have the option to click on the 'View Report' link. This will provide you with a detailed report that shows the specific data source that was used to create the graph.
3. The data for this graph is obtained from Cost of Goods Sold-Paper in QSR Owners Report under Management Report.
15. Total Sales
1. Total sales refers to the total amount of revenue that a quick service restaurant (QSR) generates from the sale of its food, beverages, and other products or services within a specific time frame. It provides a comprehensive overview of the QSR's financial performance and reflects the overall income earned by the business.
2. To generate the graph, simply select the desired time period by choosing the start and end dates. Additionally, while viewing the graph page, you have the option to click on the 'View Report' link. This will provide you with a detailed report that shows the specific data source that was used to create the graph.
3. The data for this graph is obtained from the Total Sales amount listed in the QSR Owners report, which can be accessed in the Management Report section of Docyt.
