Docyt has identified several key performance indicators (KPIs) that are specifically important for hospitality business owners:
1. Net Profit
1. To access the dashboard, click on the 'Dashboard' option in the menu bar and select the specific dashboard you want from the available options in the dropdown list.

2. To access the bar graph displaying the Net Profit, simply click on the 'Net Profit' option in the left navigation menu. Once there, you can also click on the 'View Report' link within the bar graph to open a detailed report and see the data source used to create the graph. The graph is created using the Net Profit amount from the Profit and Loss statement, which can be found in the Basic menu under the Business Reports section of Docyt.
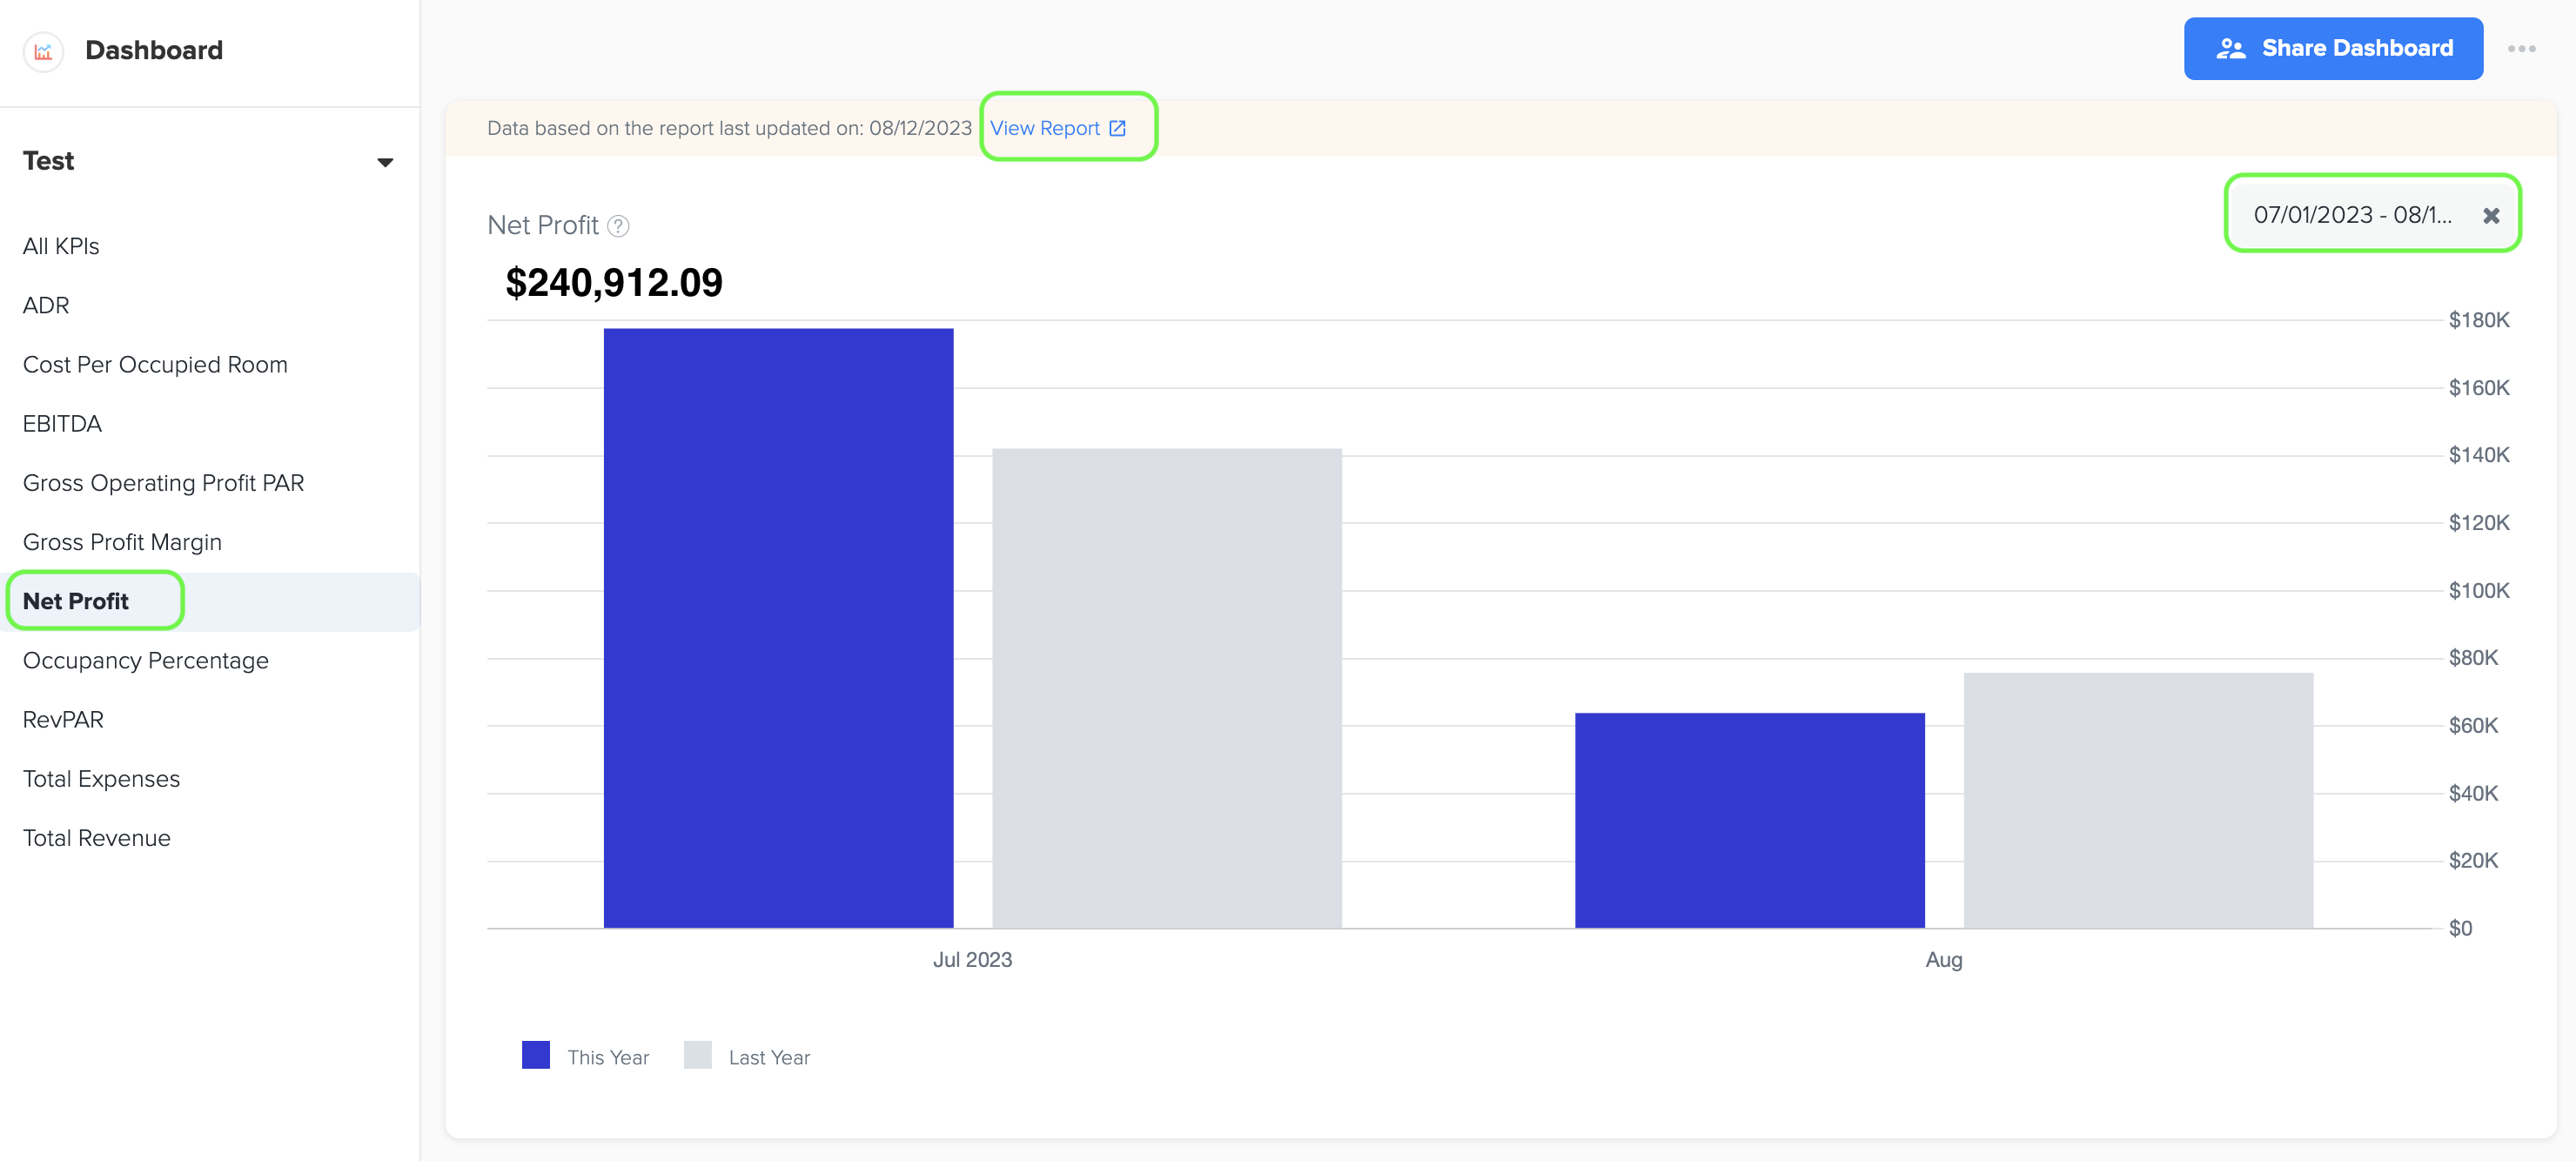
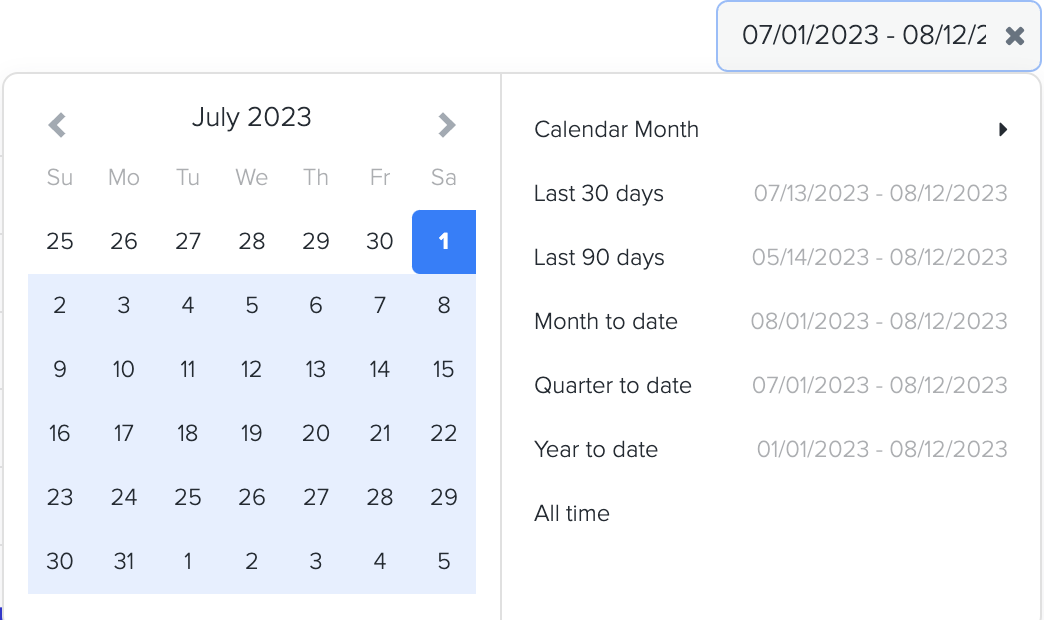
3. To create a bar graph, you can easily choose the specific time period by selecting the start and end dates. This allows you to visualize the data in a clear and organized manner.
4. The formula for calculating the net profit before tax of a hospitality business is:
Net Profit Before Tax = Total Revenue - Cost of Goods Sold (COGS) - Total Expenses (Operating Expenses)
Here are the key factors used in the calculation:
a. Total Revenue: This includes all the income generated by the hotel from various sources, such as room revenue, food and beverage sales, event bookings, spa services, and any other revenue streams associated with the hotel's operations.
b. Cost of Goods Sold (COGS): This represents the direct costs associated with providing goods and services in the hotel. It includes expenses related to food and beverage production, including raw materials, ingredients, packaging, and any other direct costs tied to the production of items sold.
c. Total Expenses (Operating Expenses): These are the ongoing costs incurred in operating the hotel. It includes expenses such as labor costs (staff wages and benefits), utility expenses (electricity, water, gas), property maintenance and repairs, marketing and advertising expenses, administrative expenses, property taxes, insurance premiums, and other expenses necessary for running the hotel.
5. To determine the net profit of a hotel, subtract the cost of goods sold (COGS) and operating expenses from the total revenue. Net profit represents the amount of profit that the hotel retains after deducting all direct costs and operating expenses.
6. The Net Profit dashboard in Docyt displays the Month on the X-axis and the Net Profit Amount on the Y-axis. Additionally, it includes a grey color bar to compare the net profit amount with the previous year on a month-to-month basis.
2. Total Expenses (Excluding COGS)
1. To access the bar graph showing Total Expenses, you can easily navigate to the left menu and choose the 'Total Expenses' option.
2. To generate the bar graph, simply select the desired time period by choosing the start and end dates.
3. Furthermore, while viewing the graph page, you have the option to click on the 'View Report' link. This will provide you with a detailed report and allow you to see the specific data source that was utilized to create the graph.
4. The data for this graph is obtained from the Total Expenses amount listed in the Profit and Loss statement. You can find the Profit and Loss statement in the Basic menu under the Business Reports section of Docyt.
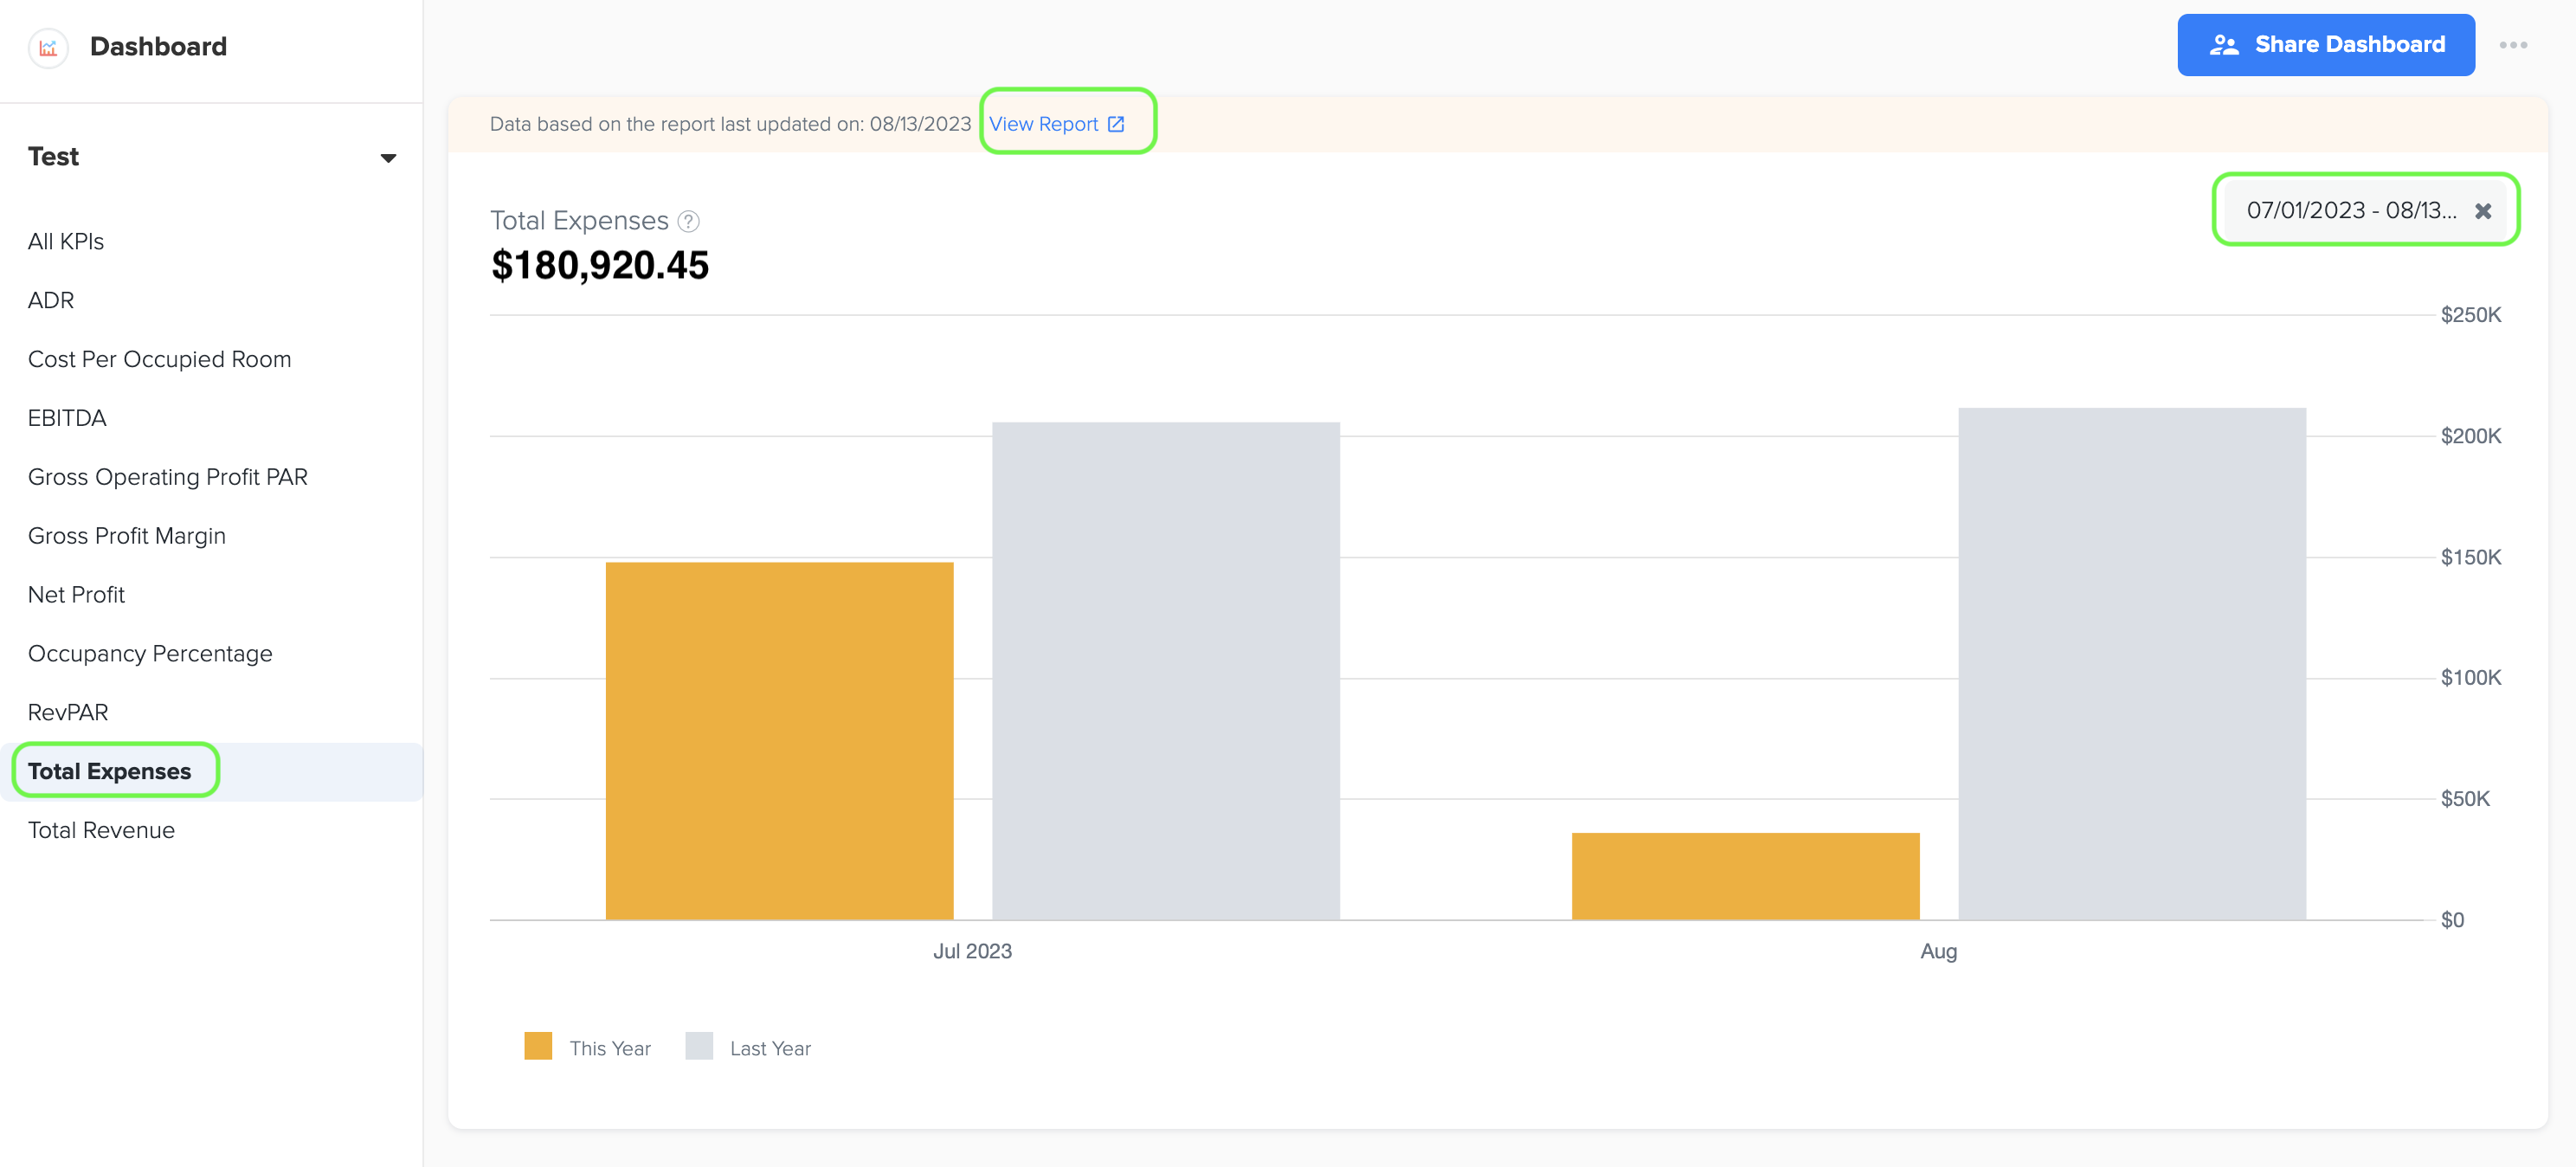
5. Total expenses, excluding the Cost of Goods Sold (COGS), for a hotel business refer to the overall costs and expenditures incurred in operating the establishment, excluding the direct costs associated with providing goods and services. It includes expenses such as labor costs (staff wages and benefits), utility expenses (electricity, water, gas), property maintenance and repairs, marketing and advertising expenses, administrative expenses, and other expenses necessary for running the hotel.
3. Total Revenue
1. To access the bar graph showcasing Total Revenue, you can easily navigate to the left menu and choose the 'Total Revenue' option. By selecting the desired time period through the start and end dates, you can generate the bar graph for analysis.
2. To access a detailed report and view the data source used to create the graph, simply click on the 'View Report' link when you're on the graph page. This will provide you with valuable insights and information about the graph's data.
3. The data for this graph is obtained from the Total Income amount listed in the Profit and Loss statement, which can be accessed in the Basic menu under the Business Reports section of Docyt.
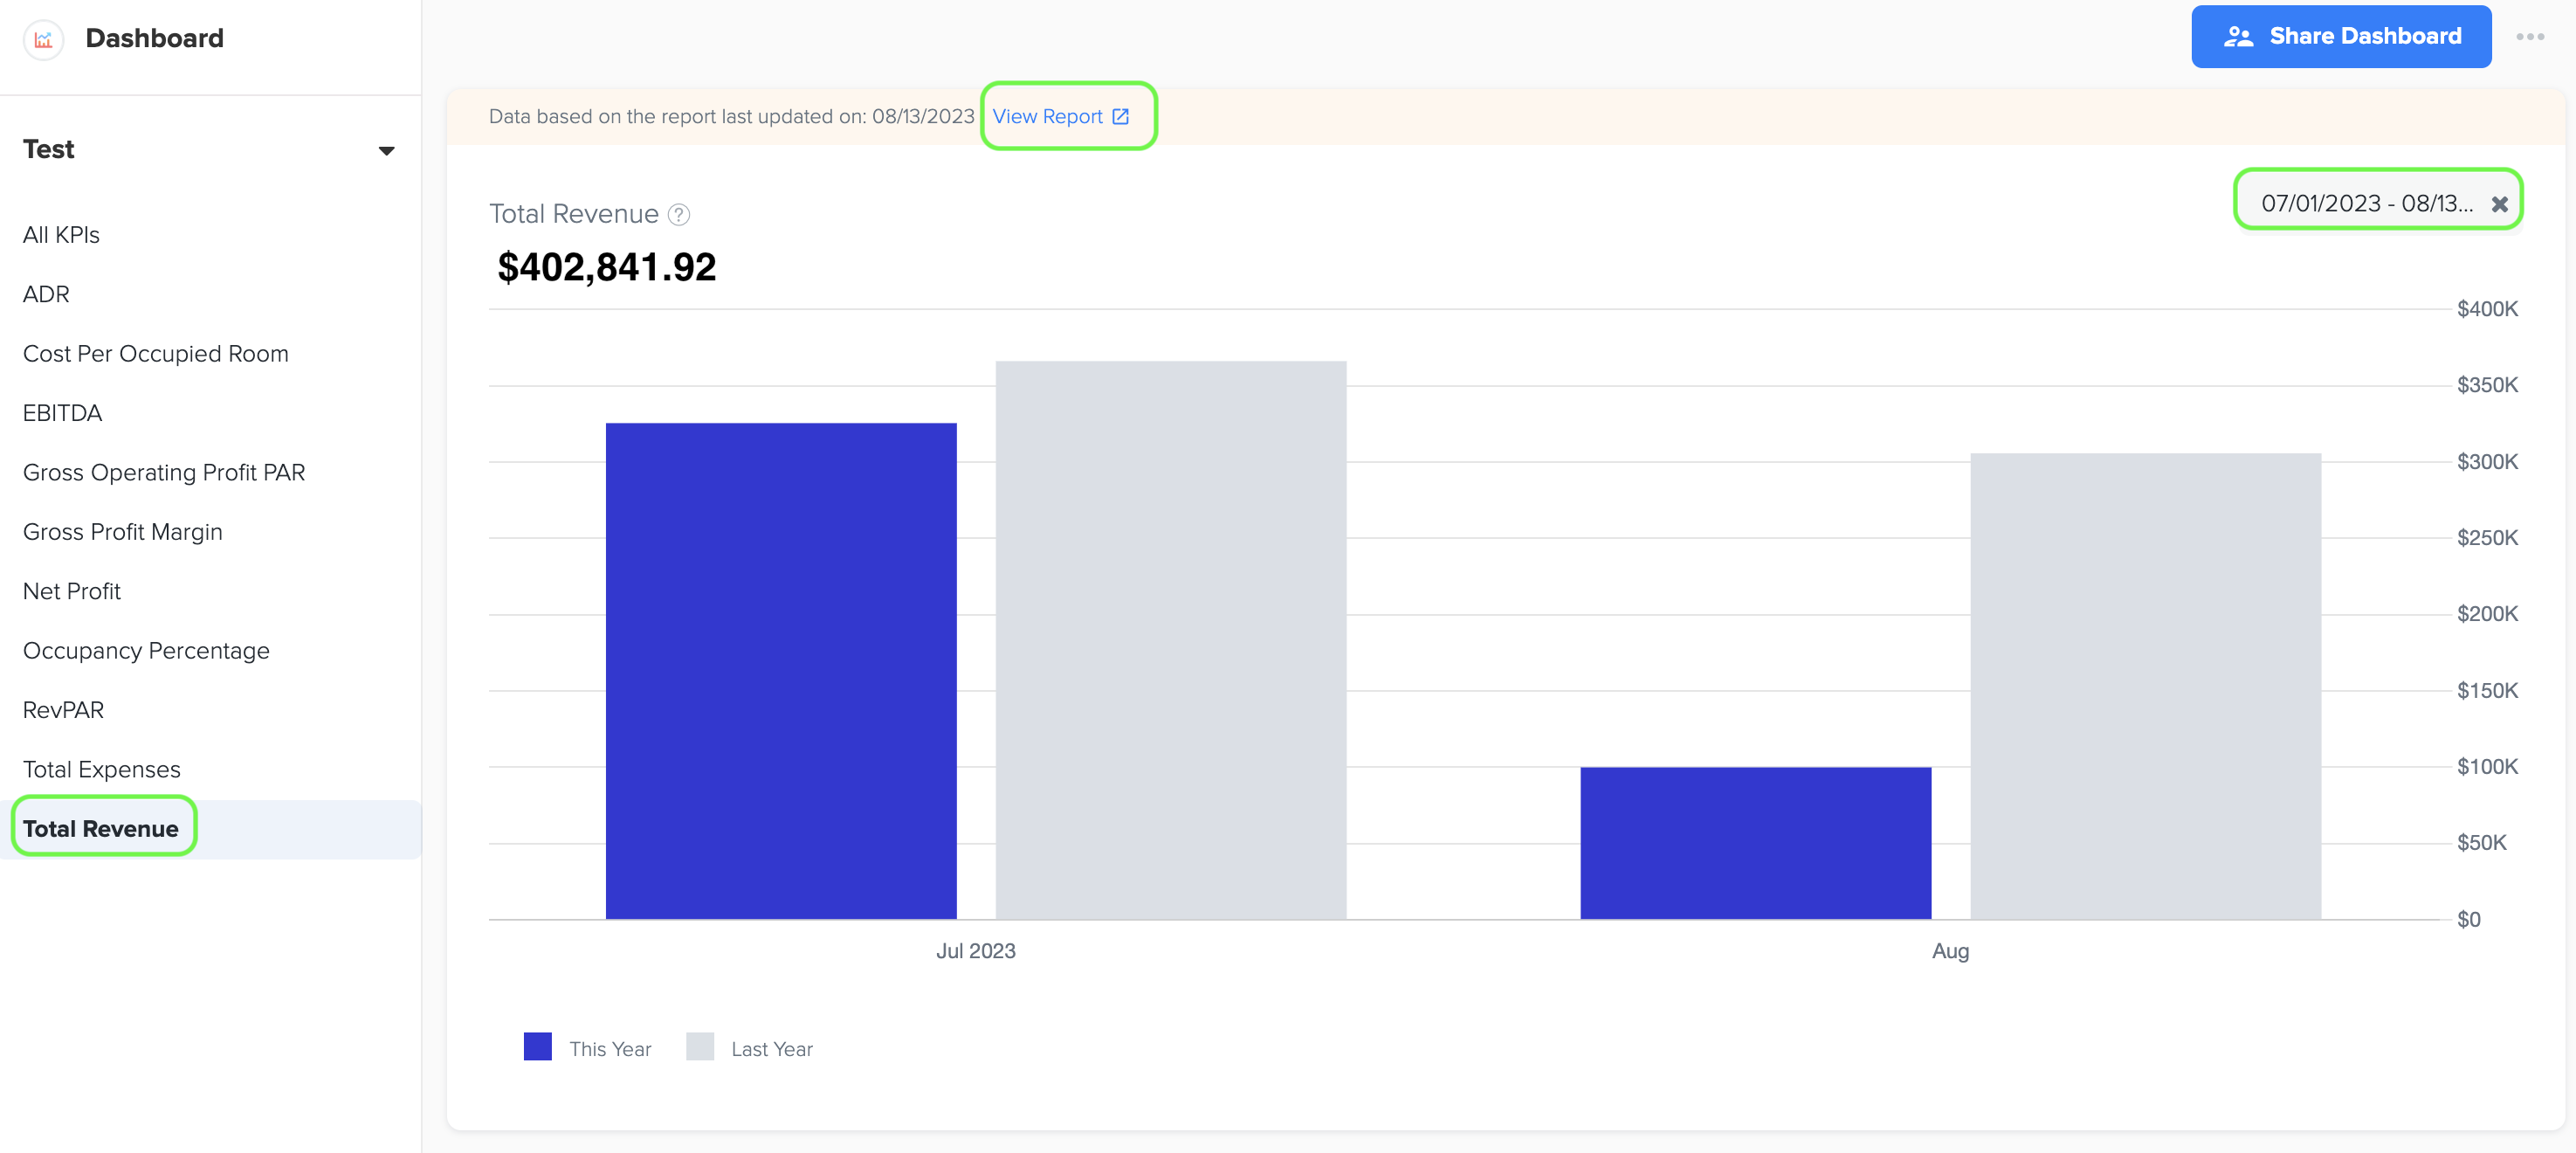
4. The term 'Total Revenue' refers to the overall income or sales generated by a business from its operations during a specific period. The total revenue of a hospitality business typically includes the following components:
-
Room Revenue: This is the income generated from renting out hotel rooms or other types of accommodation. It includes revenue from both individual guests and group bookings.
-
Food and Beverage Revenue: This comprises the income earned from the sale of food and beverages in restaurants, bars, cafes, room service, banquet services, and any other dining facilities within the hospitality establishment.
-
Event Revenue: If the business hosts events such as weddings, conferences, meetings, or parties, the revenue generated from event bookings, venue rentals, catering services, and related event services would contribute to the total revenue.
-
Ancillary Revenue: This includes income from additional services or products offered by the business, such as spa services, fitness facilities, laundry services, parking fees, internet access, in-room entertainment, and other supplementary offerings.
-
Other Revenue Sources: Any miscellaneous sources of income that are not directly related to the core services provided by the hospitality business, such as commissions from travel agencies, partnerships with local attractions, or sales of merchandise, may be included as well.
4. Gross Profit Margin (%)
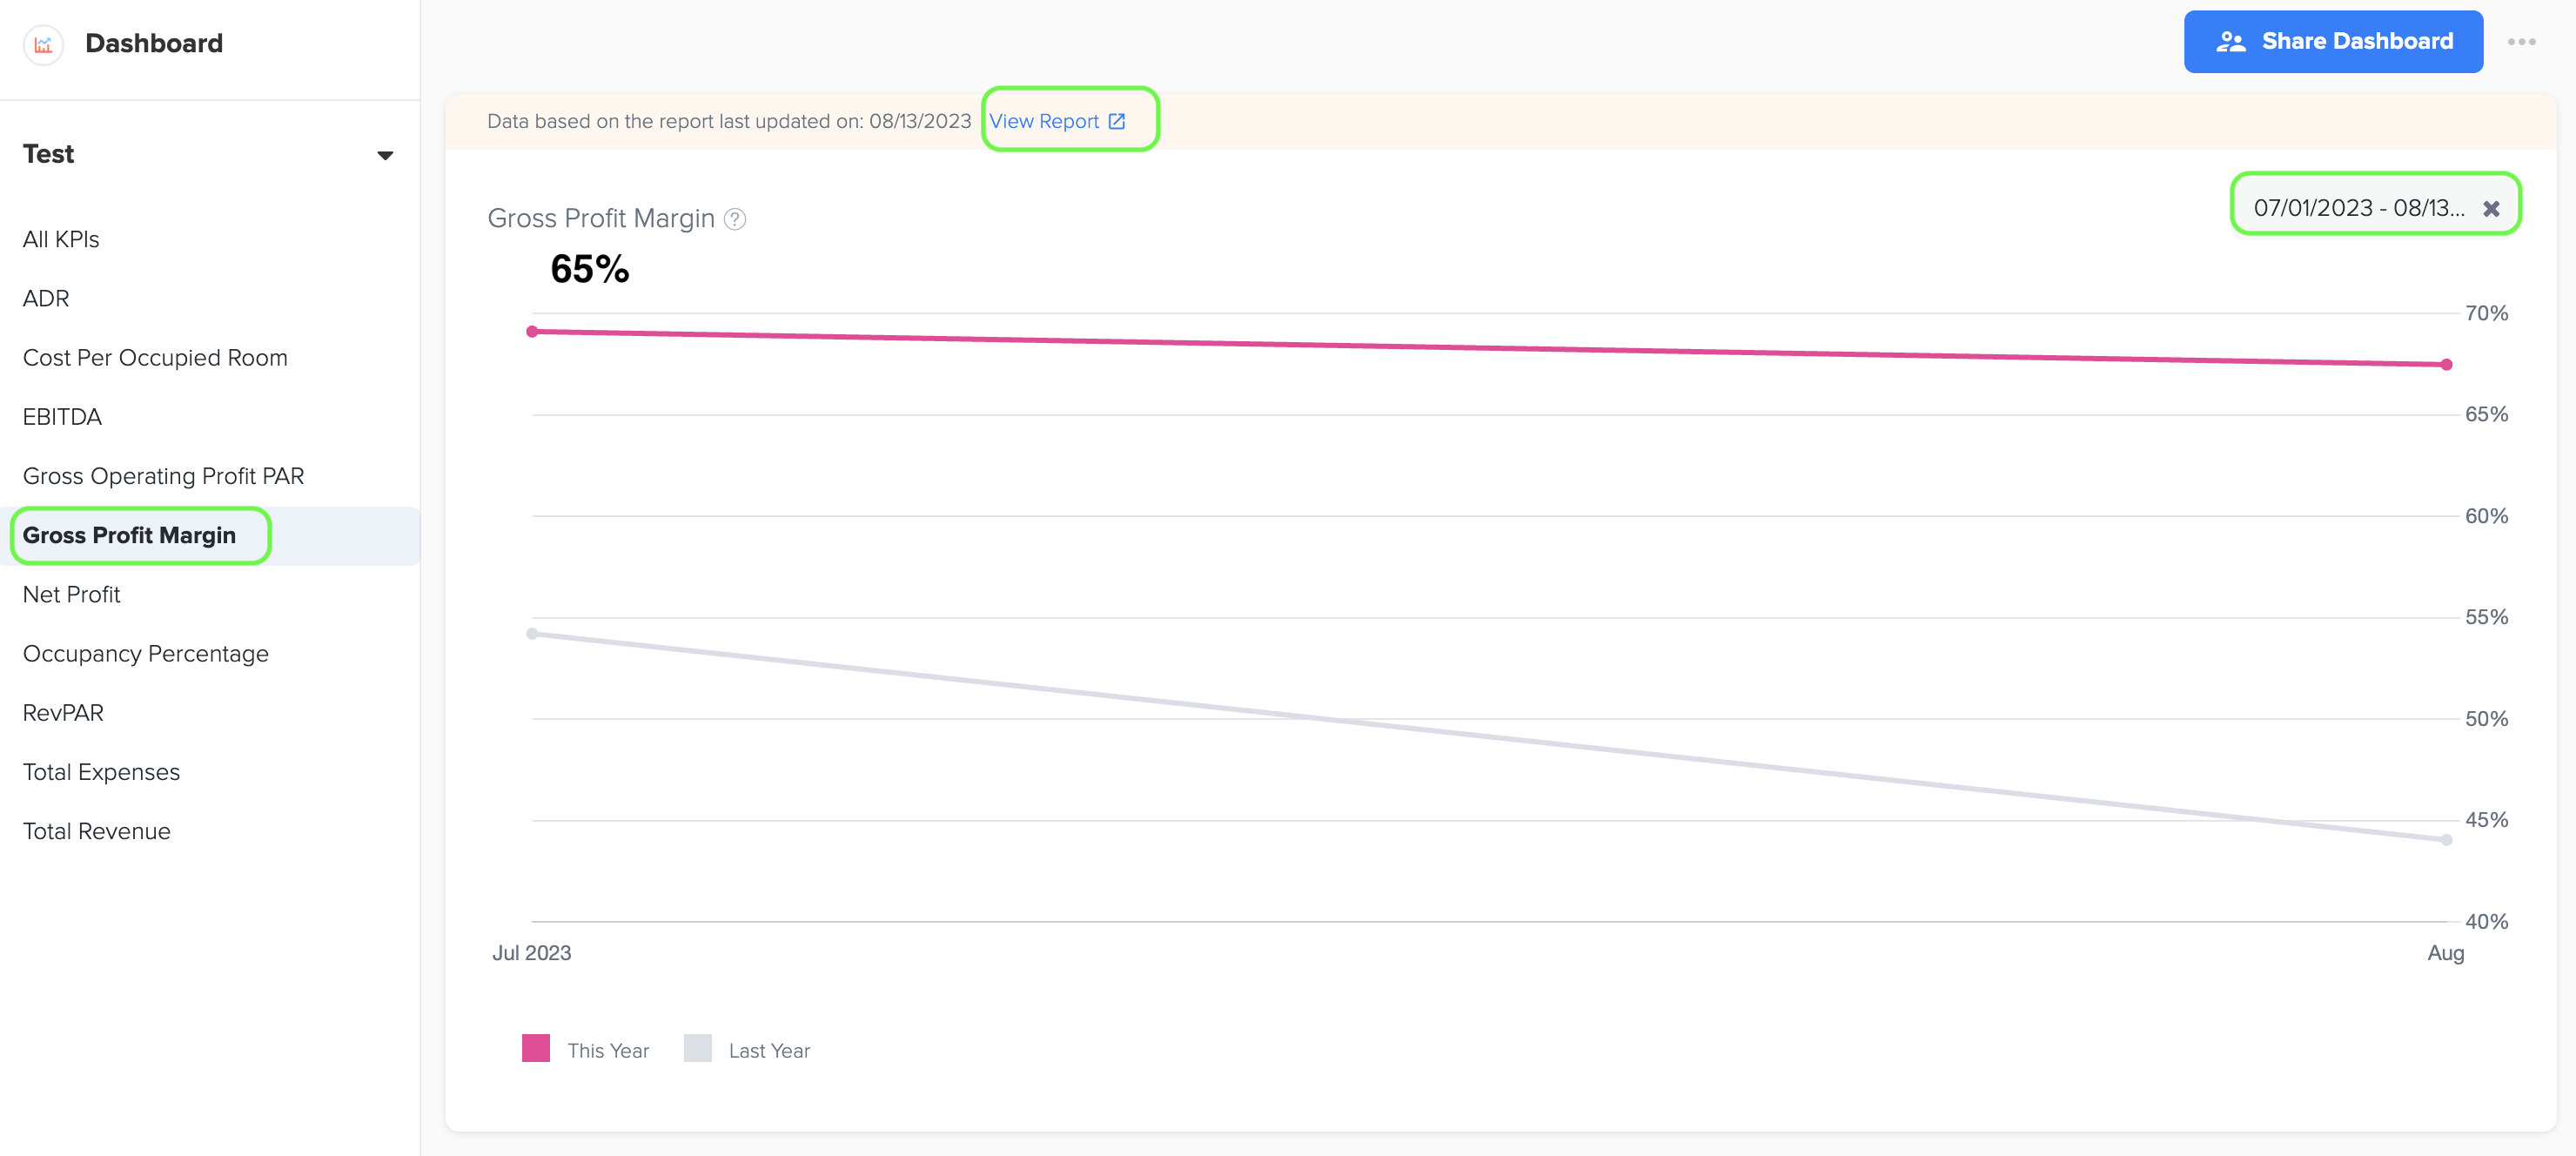
1. To view the line graph showing the Gross Profit Margin (%), simply go to the left menu and select the 'Gross Profit Margin' option. You can easily choose the desired time period by selecting the start and end dates. Once you're on the graph page, click on the 'View Report' link to access a detailed report and see the data source used to create the graph. This will provide you with valuable insights into the profitability of your business and how it compares to previous periods.
2. The data for this graph is obtained from the Gross Operating Profit % in the Owner’s Report (Management Report), which provides valuable insights into the profitability of your business and how it compares to previous periods.
3. The formula for Gross Operating Profit Percentage is:
Gross Operating Profit % = (Gross Operating Profit / Total Operating Revenue) * 100.
Where,
Gross Operating Profit is the total revenue from sales minus the cost of goods sold (COGS) and operating expenses directly associated with the production of goods or services.
Total Operating Revenue refers to the total sales or income generated from the core business activities before deducting any expenses.
4. The higher the Gross Operating Profit %, the more efficient the company is in generating profit from its core business activities.
5. Revenue Per Available Room (RevPAR)
1. To view the bar graph showcasing the Revenue Per Available Room (RevPAR), simply navigate to the left menu and select the 'RevPAR' option. You can easily select the desired time period by choosing the start and end dates. Once you're on the graph page, click on the 'View Report' link to access a detailed report and see the data source used to create the graph. This will provide you with valuable insights into the financial performance and efficiency of your hotel's rooms division.
2. The data for RevPAR is sourced from the summary section of the Owner’s Operating Statement in the Management Report, which can be found in the Business Reports menu of Docyt.
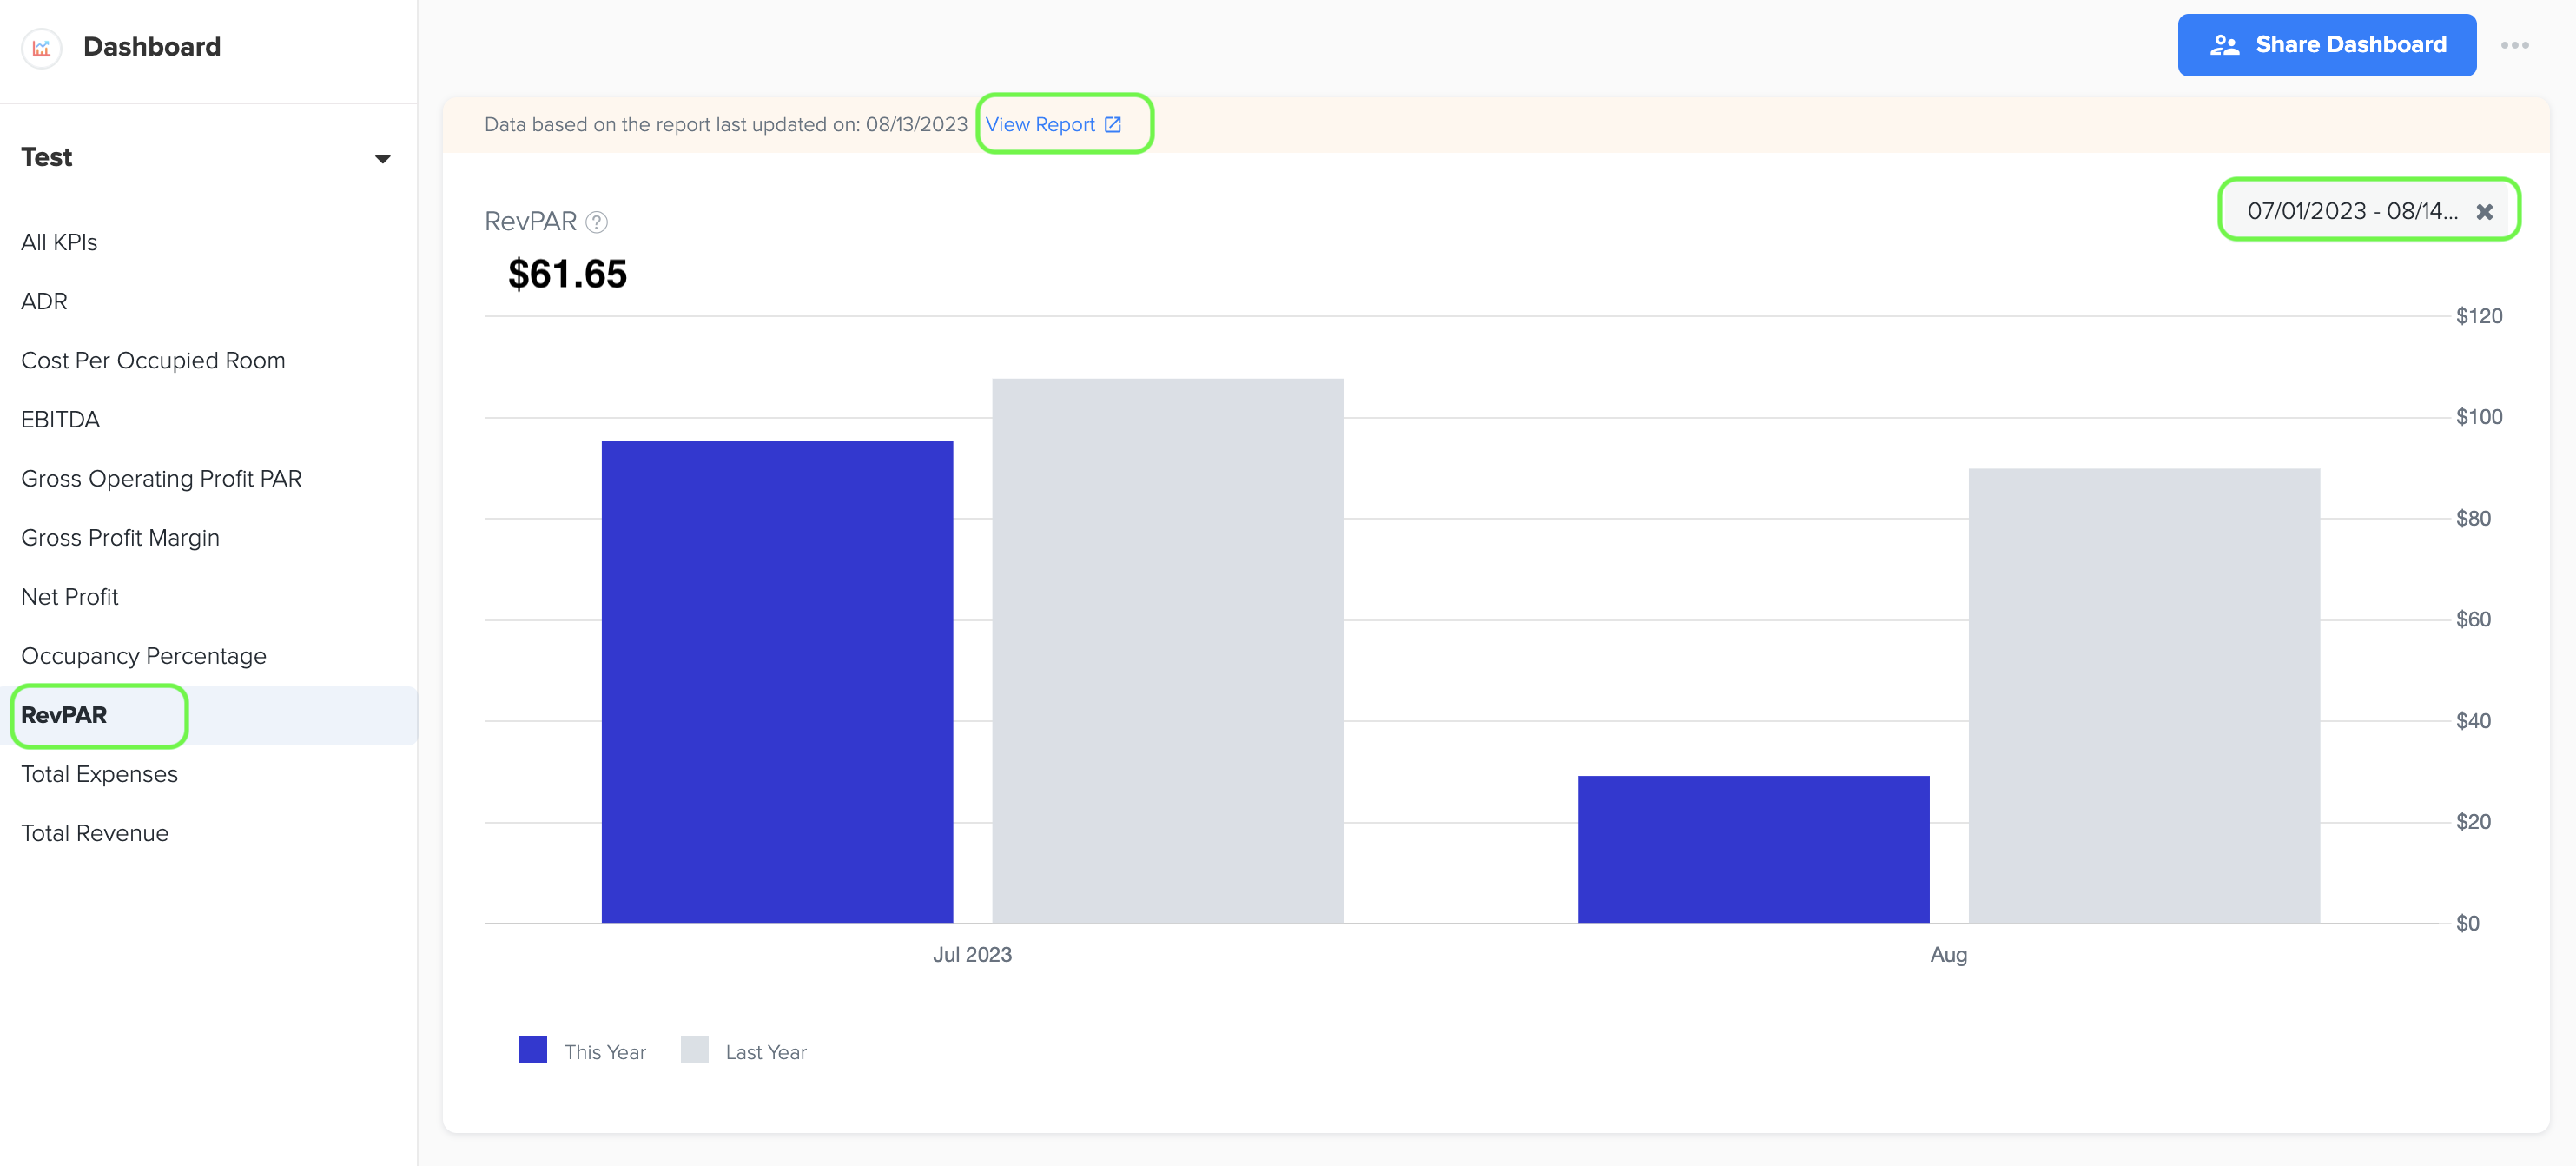
3. RevPAR, which stands for Revenue Per Available Room, is a key performance metric used in the hotel industry to evaluate the financial performance and efficiency of a hotel's rooms division. It provides valuable insights into a hotel's ability to generate revenue from its available room inventory. RevPAR allows hotel operators and investors to assess and compare the financial performance of different hotels, irrespective of their size or number of rooms.
4. The formula for calculating RevPAR is as follows:
RevPAR = Total Room Revenue / Total Number of Available Rooms.
Where,
Total Room Revenue is the sum of all room revenues generated during the period being measured (e.g., a day, a month, or a year).
Total Number of Available Rooms is the total number of rooms that were available for sale during the same period.
6. Average Daily Rate (ADR)
1. To view the bar graph showcasing the Average Daily Rate (ADR), simply go to the left menu and select the 'ADR' option. You can easily choose the desired time period by selecting the start and end dates. Once you're on the graph page, click on the 'View Report' link to access a detailed report and see the data source used to create the graph. This will provide you with valuable insights into the pricing strategy and revenue generation of your hotel's room division.
2. The data for ADR is sourced from the summary section of the Owner’s Operating Statement in the Management Report, which can be found in the Business Reports menu of Docyt.
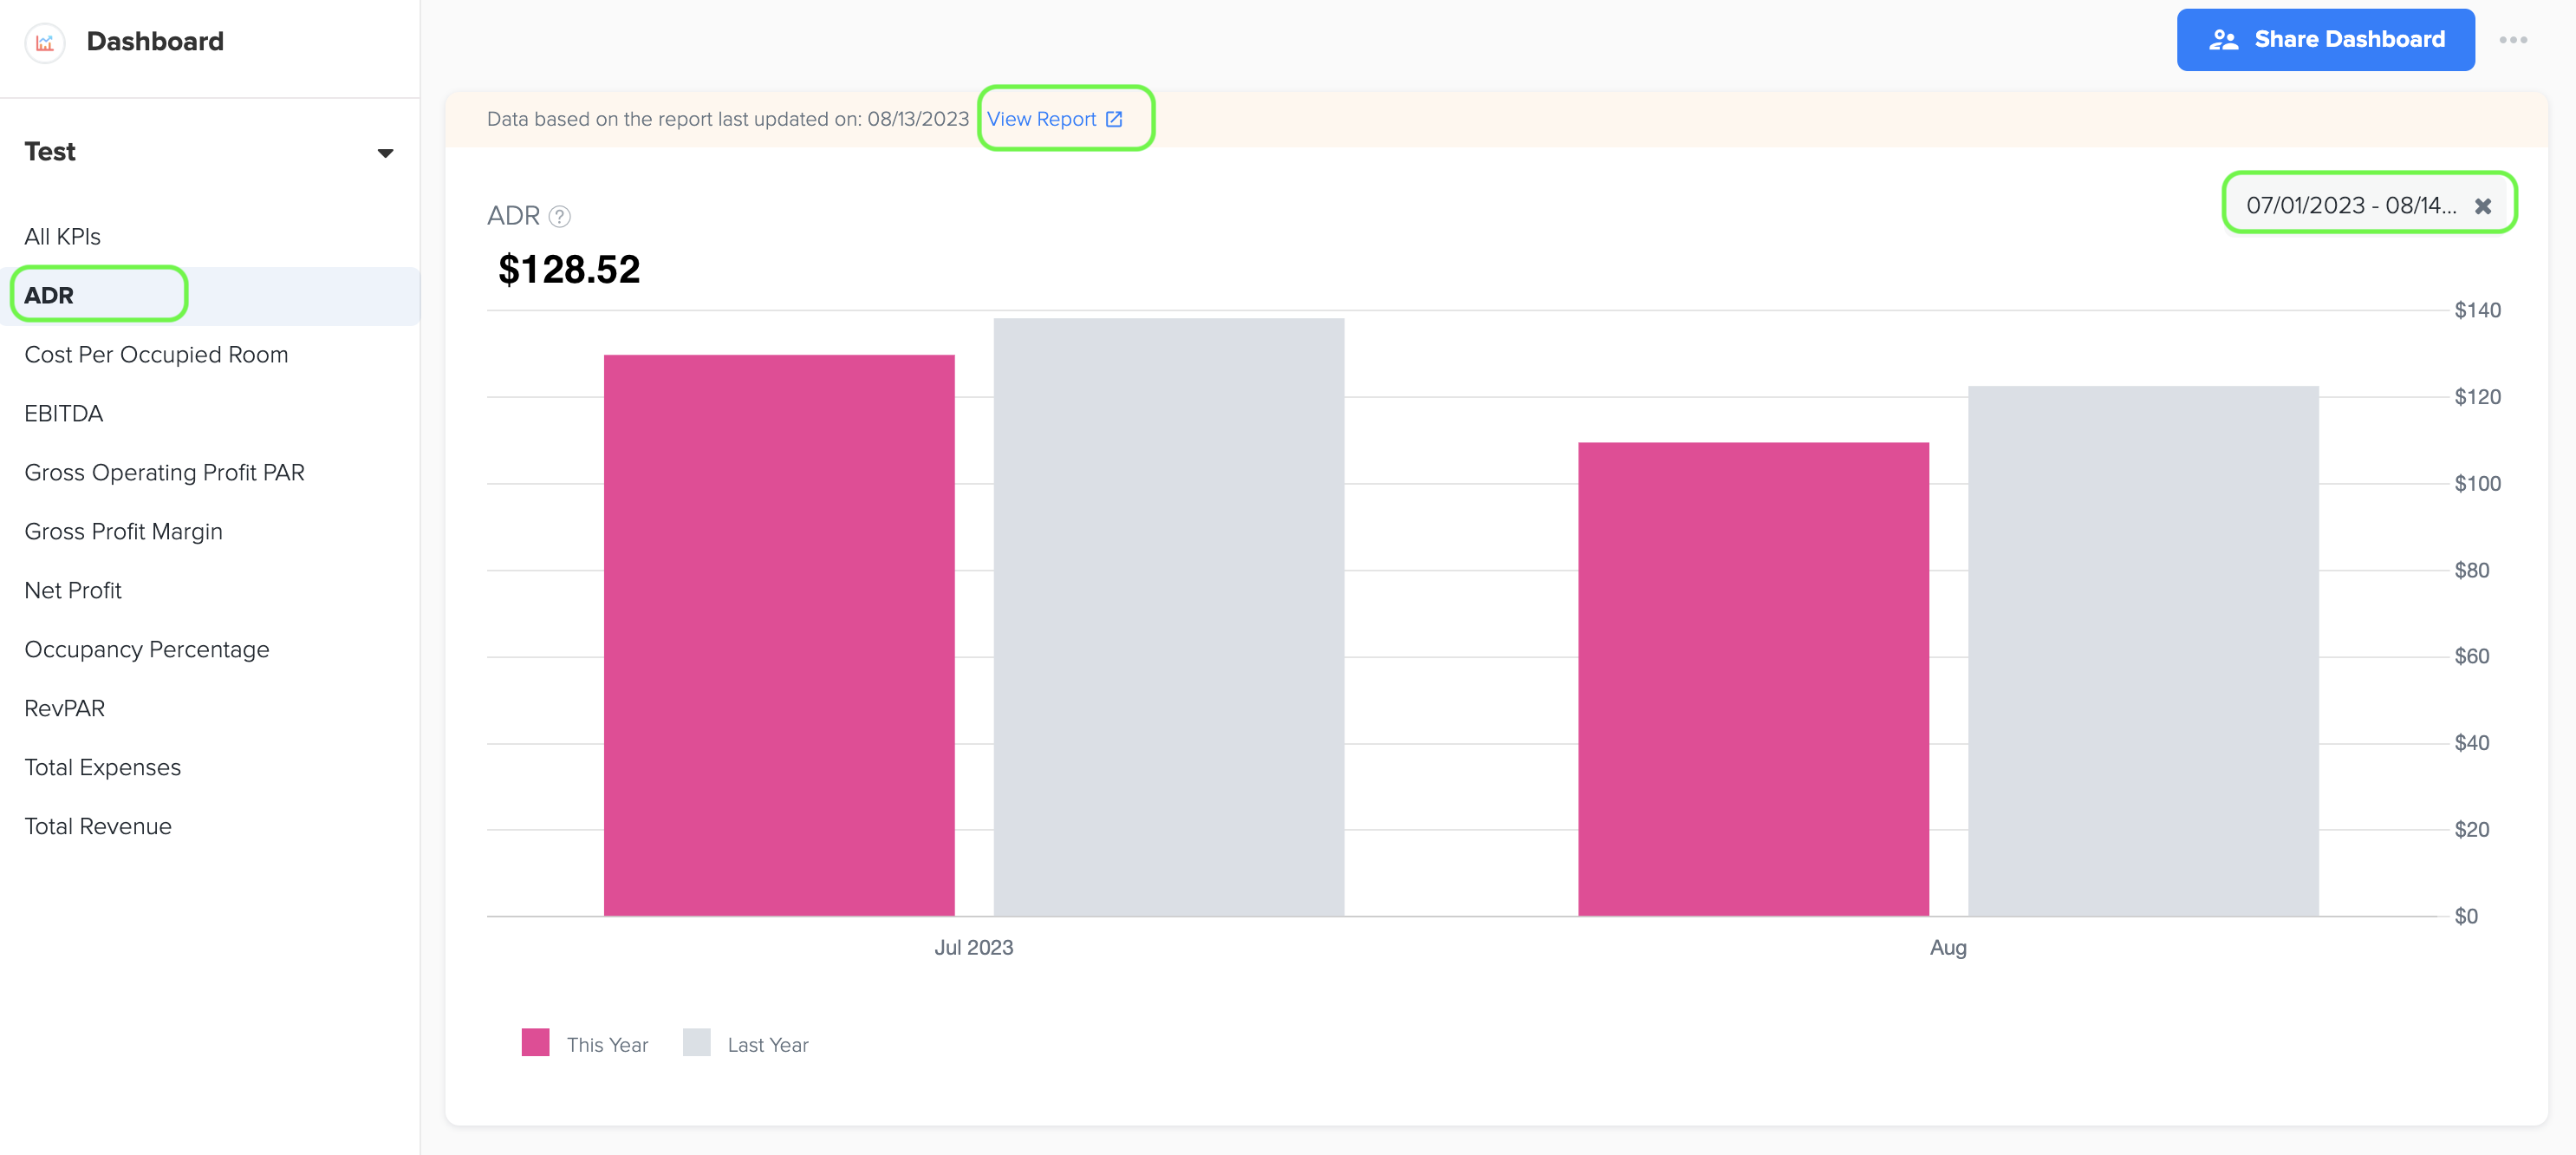
3. ADR, short for Average Daily Rate, is a crucial metric in the hotel industry that helps measure the average price or rate at which hotel rooms are sold on a daily basis. It provides valuable insights into the pricing strategy and revenue generation of a hotel's room division.
4. The formula for calculating ADR is as follows:
ADR = Total Room Revenue / Total Number of Rooms Sold
To calculate ADR, you divide the total room revenue generated by the hotel during a specific period by the total number of rooms sold (occupied) during that same period.
5. ADR represents the average price paid by guests for each room sold and serves as an indicator of the hotel's pricing power and market positioning. It helps hoteliers understand the revenue potential of their room inventory and evaluate the effectiveness of their pricing strategies.
7. Occupancy Percentage
1. To view the line graph that shows the Occupancy Percentage, simply go to the left menu and select the 'Occupancy Percentage' option. You can easily choose the desired time period by selecting the start and end dates. Once you're on the graph page, click on the 'View Report' link to access a detailed report and see the data source used to create the graph. This will provide you with valuable insights into the occupancy rate of your hotel and how it compares to previous periods.
2. The Occupancy Percentage data is sourced from the summary section of the Owner’s Operating Statement in the Management Report, which can be found in the Business Reports menu of Docyt. This valuable information provides insights into the occupancy rate of your hotel and allows you to compare it to previous periods.
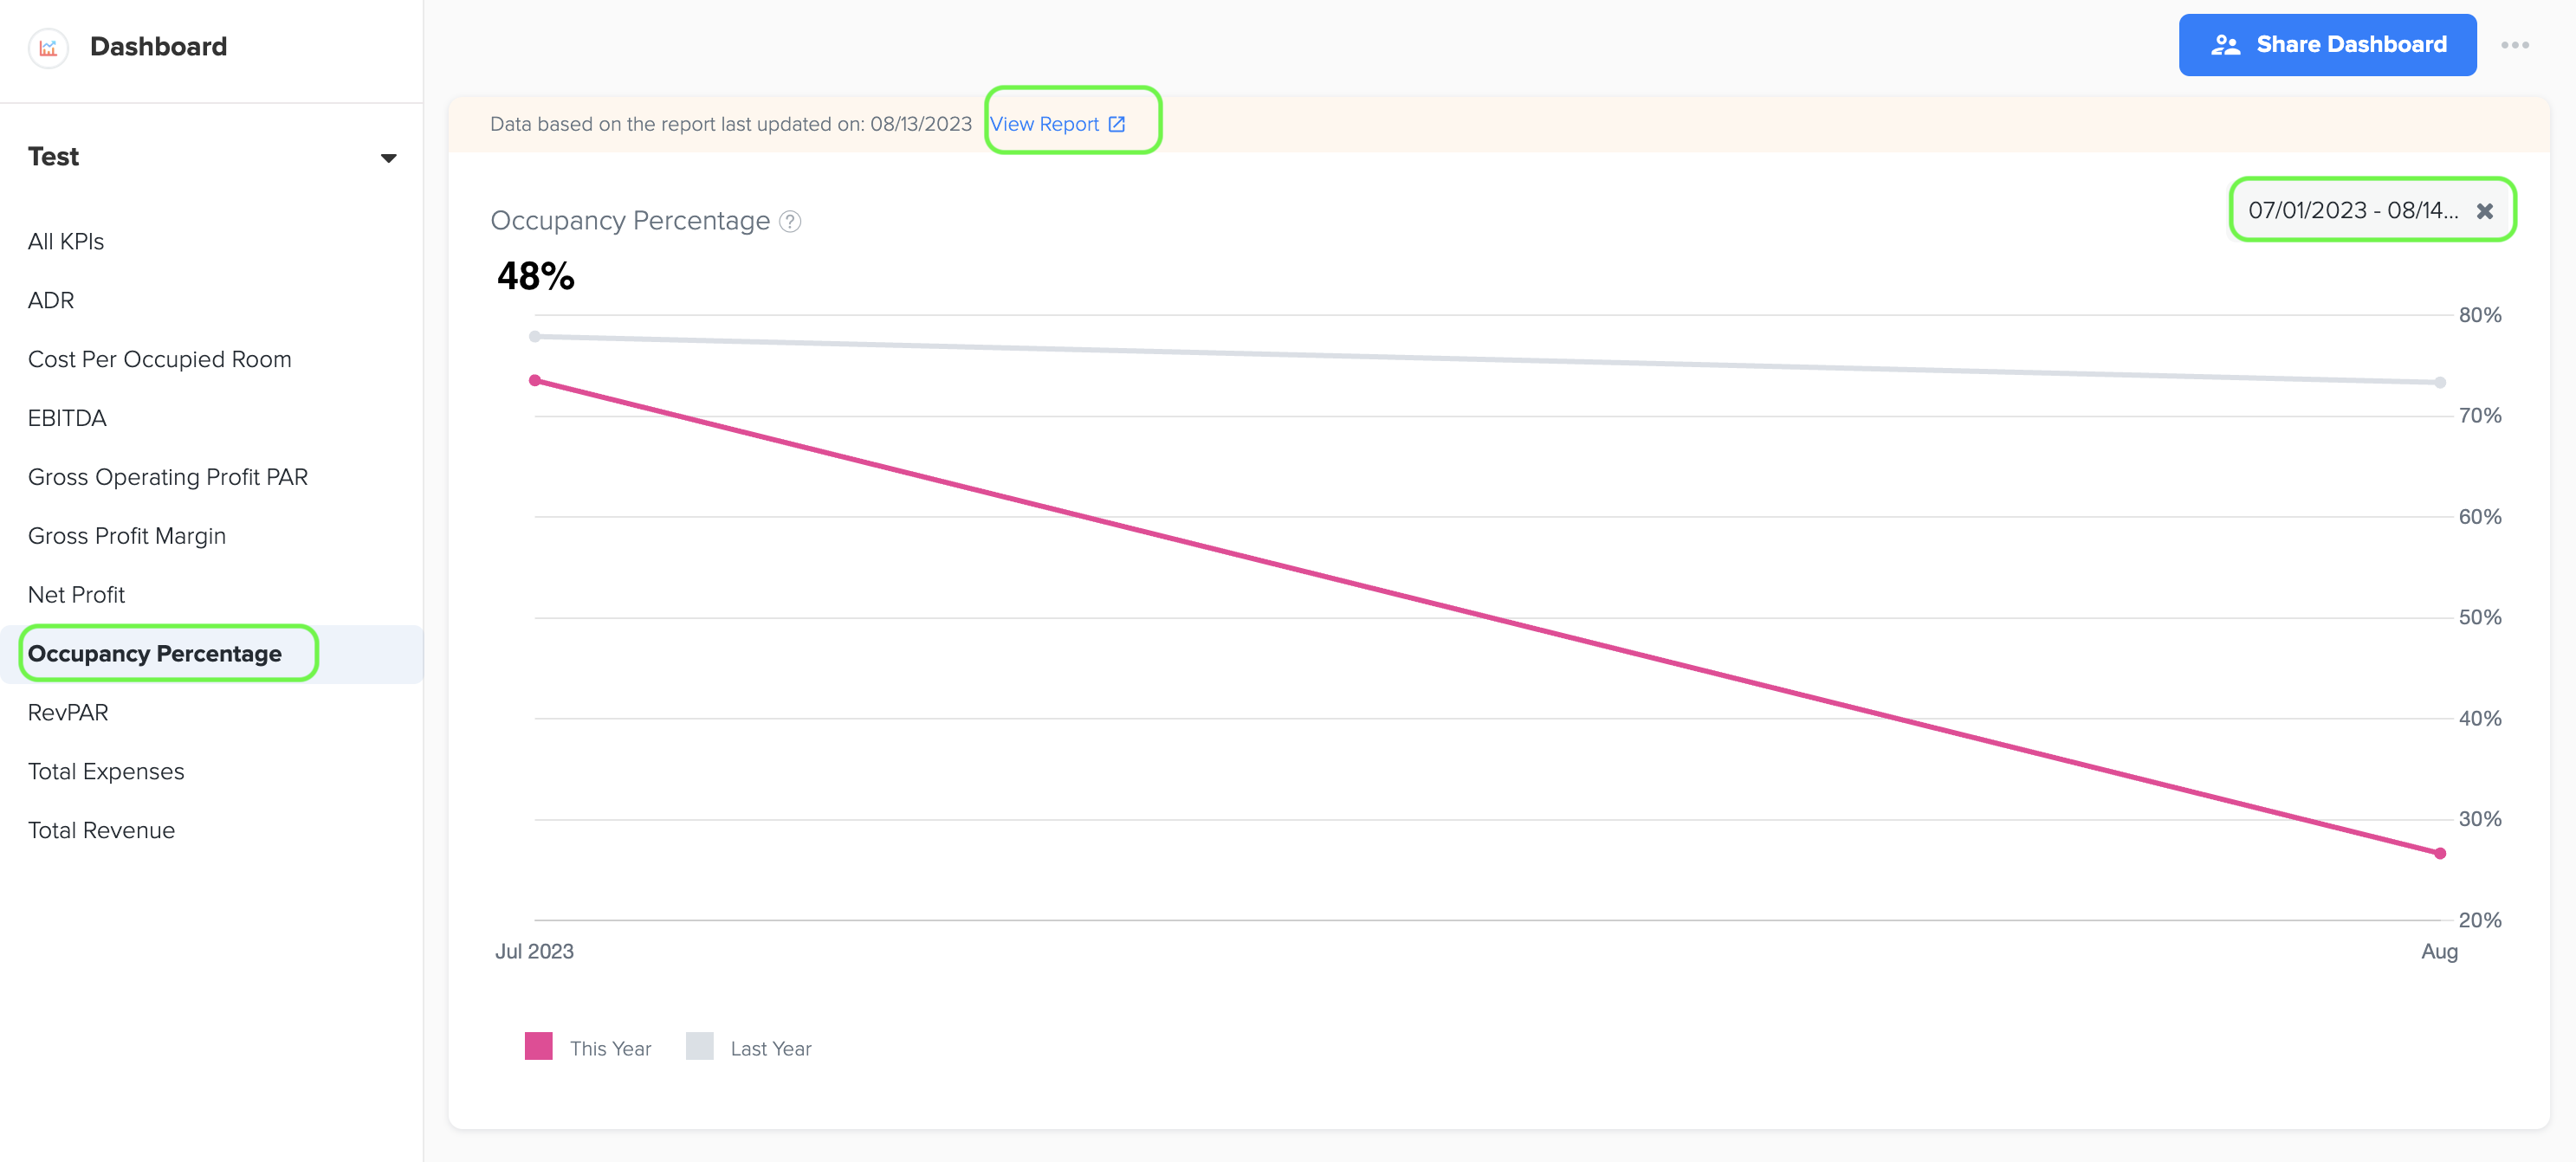
3. Occupancy percentage is a crucial measurement in the hotel industry that evaluates how effectively a hotel's available rooms are being utilized and occupied during a specific period. It offers valuable insights into the efficiency and demand for a hotel's room inventory, helping hoteliers understand how well their rooms are being utilized and how much demand there is for their accommodations.
4. The formula for calculating occupancy percentage is as follows:
Occupancy Percentage = (Total Number of Rooms Sold / Total Number of Available Rooms) x 100
To calculate occupancy percentage, you divide the total number of rooms sold (occupied) by the total number of available rooms (Rooms Available to Sell) in the hotel during a specific period. The result is then multiplied by 100 to express it as a percentage.
5. A higher occupancy percentage generally indicates strong demand, efficient operations, and effective sales and marketing efforts, which are all essential for evaluating a hotel's performance and forecasting revenue potential.
8. Gross Operating Profit per Available Room (GOPPAR)
1. To view the bar graph showcasing the Gross Operating Profit per Available Room (GOPPAR), simply go to the left menu and select the 'Gross Operating Profit PAR' option. You can easily select the desired time period by choosing the start and end dates. Once you're on the graph page, click on the 'View Report' link to access a detailed report and see the data source used to create the graph. This will provide you with valuable insights into the profitability of your hotel's room division and how it compares to previous periods.
2. The data for GOPPAR is obtained from the Owners Operating Statement, which can be found in the Business Reports menu of Docyt's Management Report.
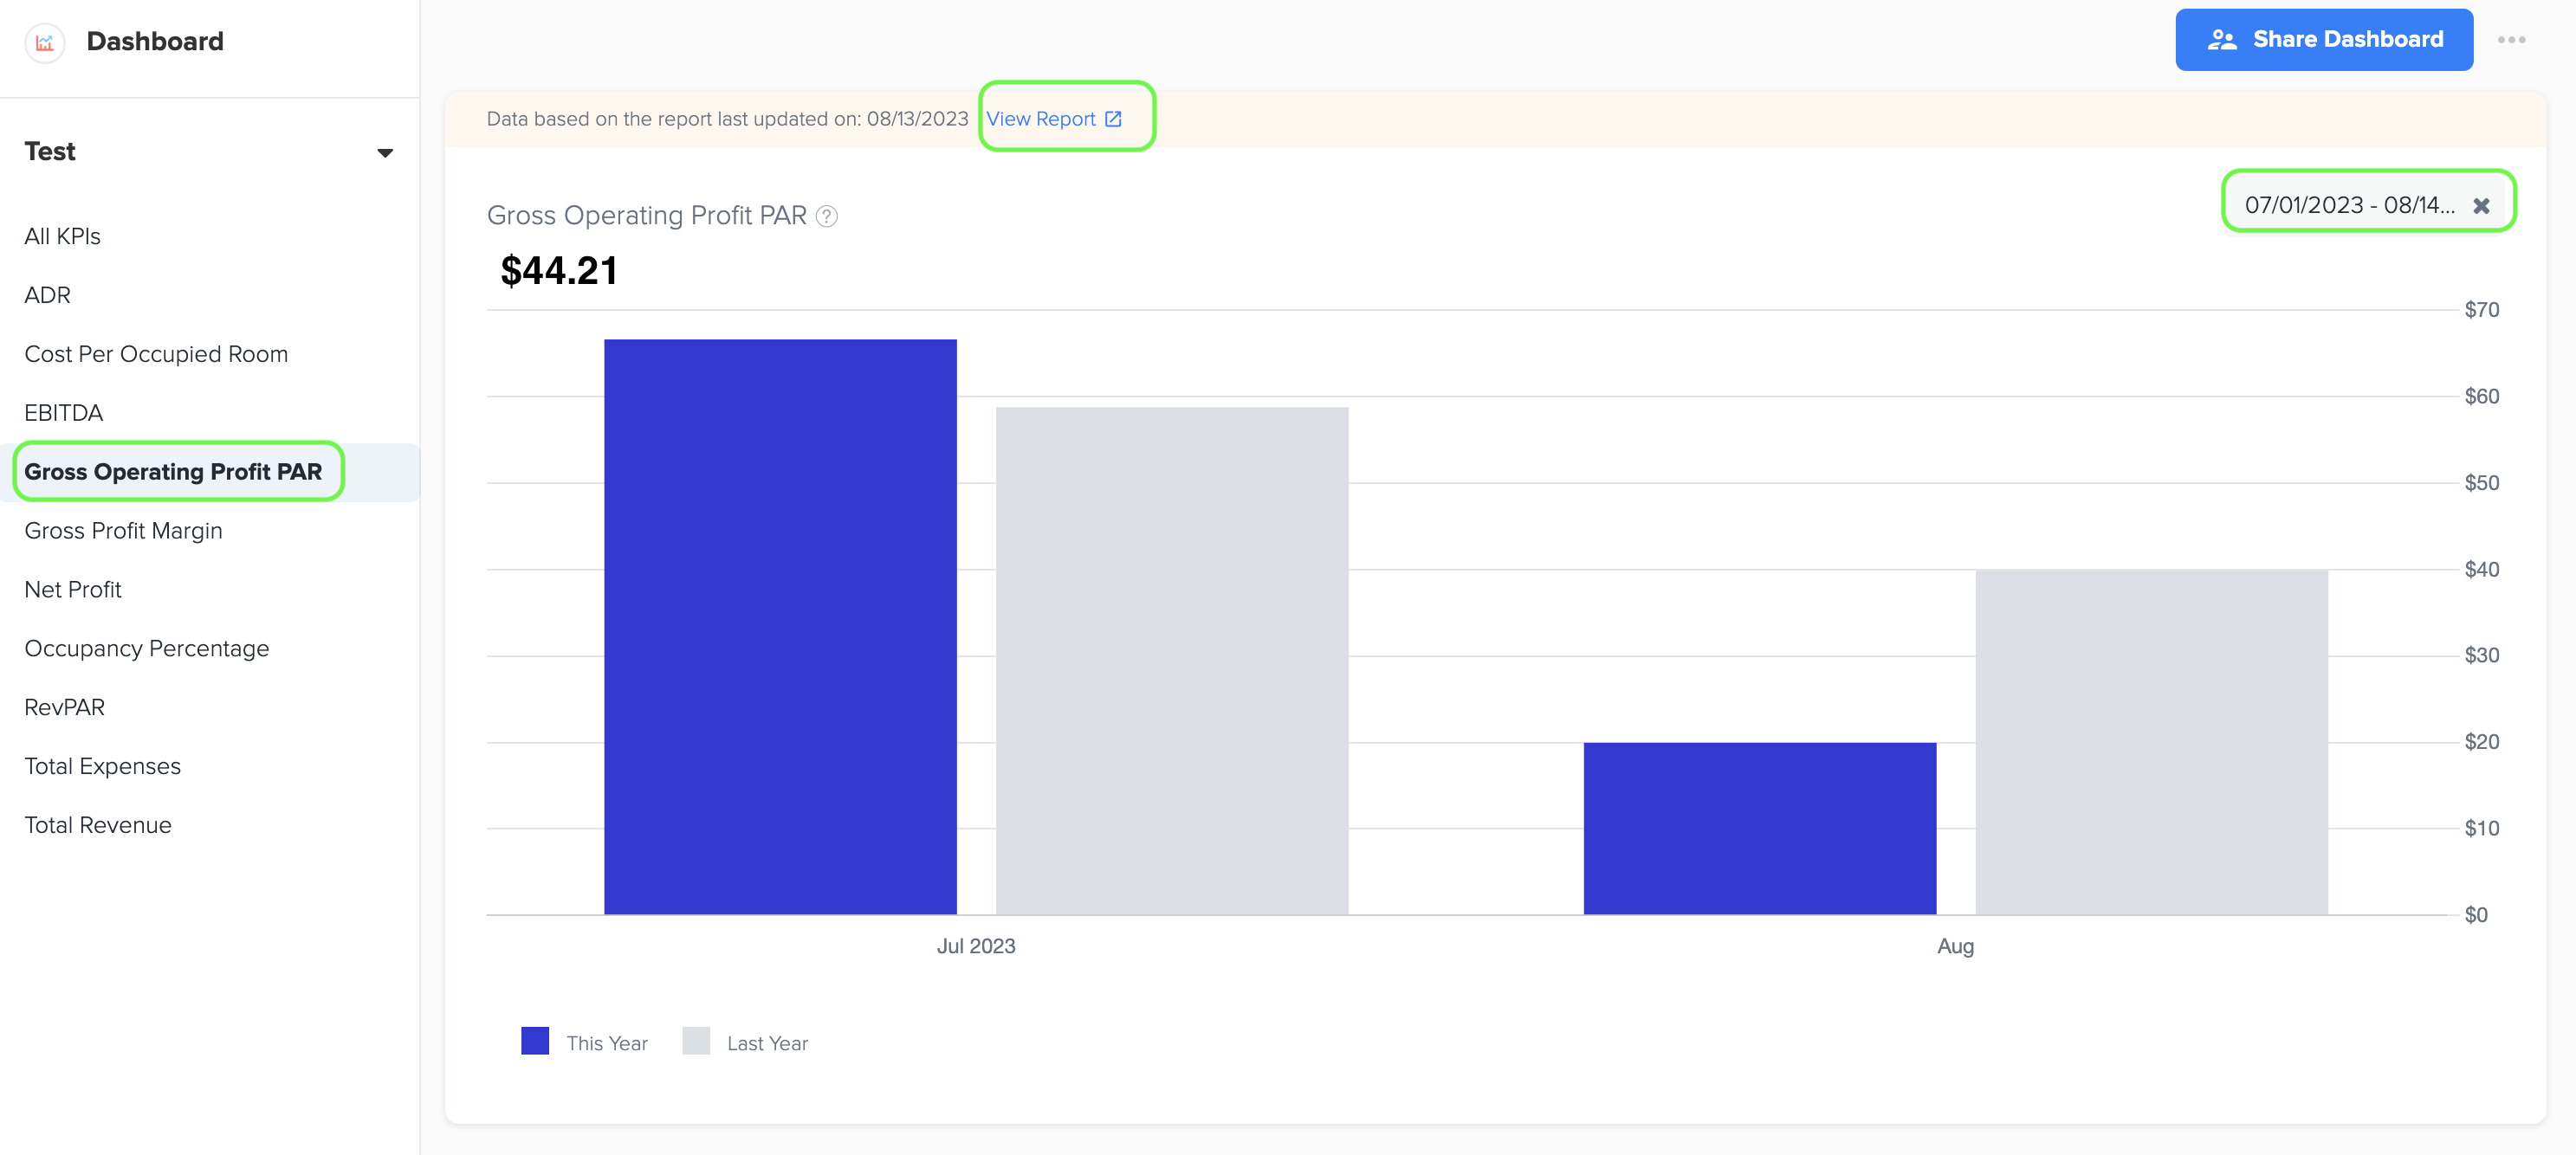
3. Gross Operating Profit per Available Room (GOPPAR) is a key performance metric used in the hotel industry to measure the profitability of a hotel's operations on a per room basis. It provides insights into the hotel's ability to generate profit from its available rooms after accounting for all operating expenses.
4. The formula for calculating GOPPAR is as follows:
GOPPAR = Gross Operating Profit / Total Available Rooms.
To calculate GOPPAR, you divide the gross operating profit of the hotel during a specific period by the total number of available rooms (Rooms available to Sell) in the hotel during that same period.
Gross Operating Profit represents the total revenue generated by the hotel from all sources, minus the direct operating expenses associated with the rooms division, such as housekeeping, laundry, maintenance, and other operational costs directly related to room operations.
5. GOPPAR takes into account the profitability of the hotel's operations per available room, allowing for a more accurate assessment of the financial performance. It provides a deeper understanding of the hotel's ability to control costs and generate profit from each room.
9. EBITDA (Earnings Before Interest, Taxes, Depreciation, and Amortization)
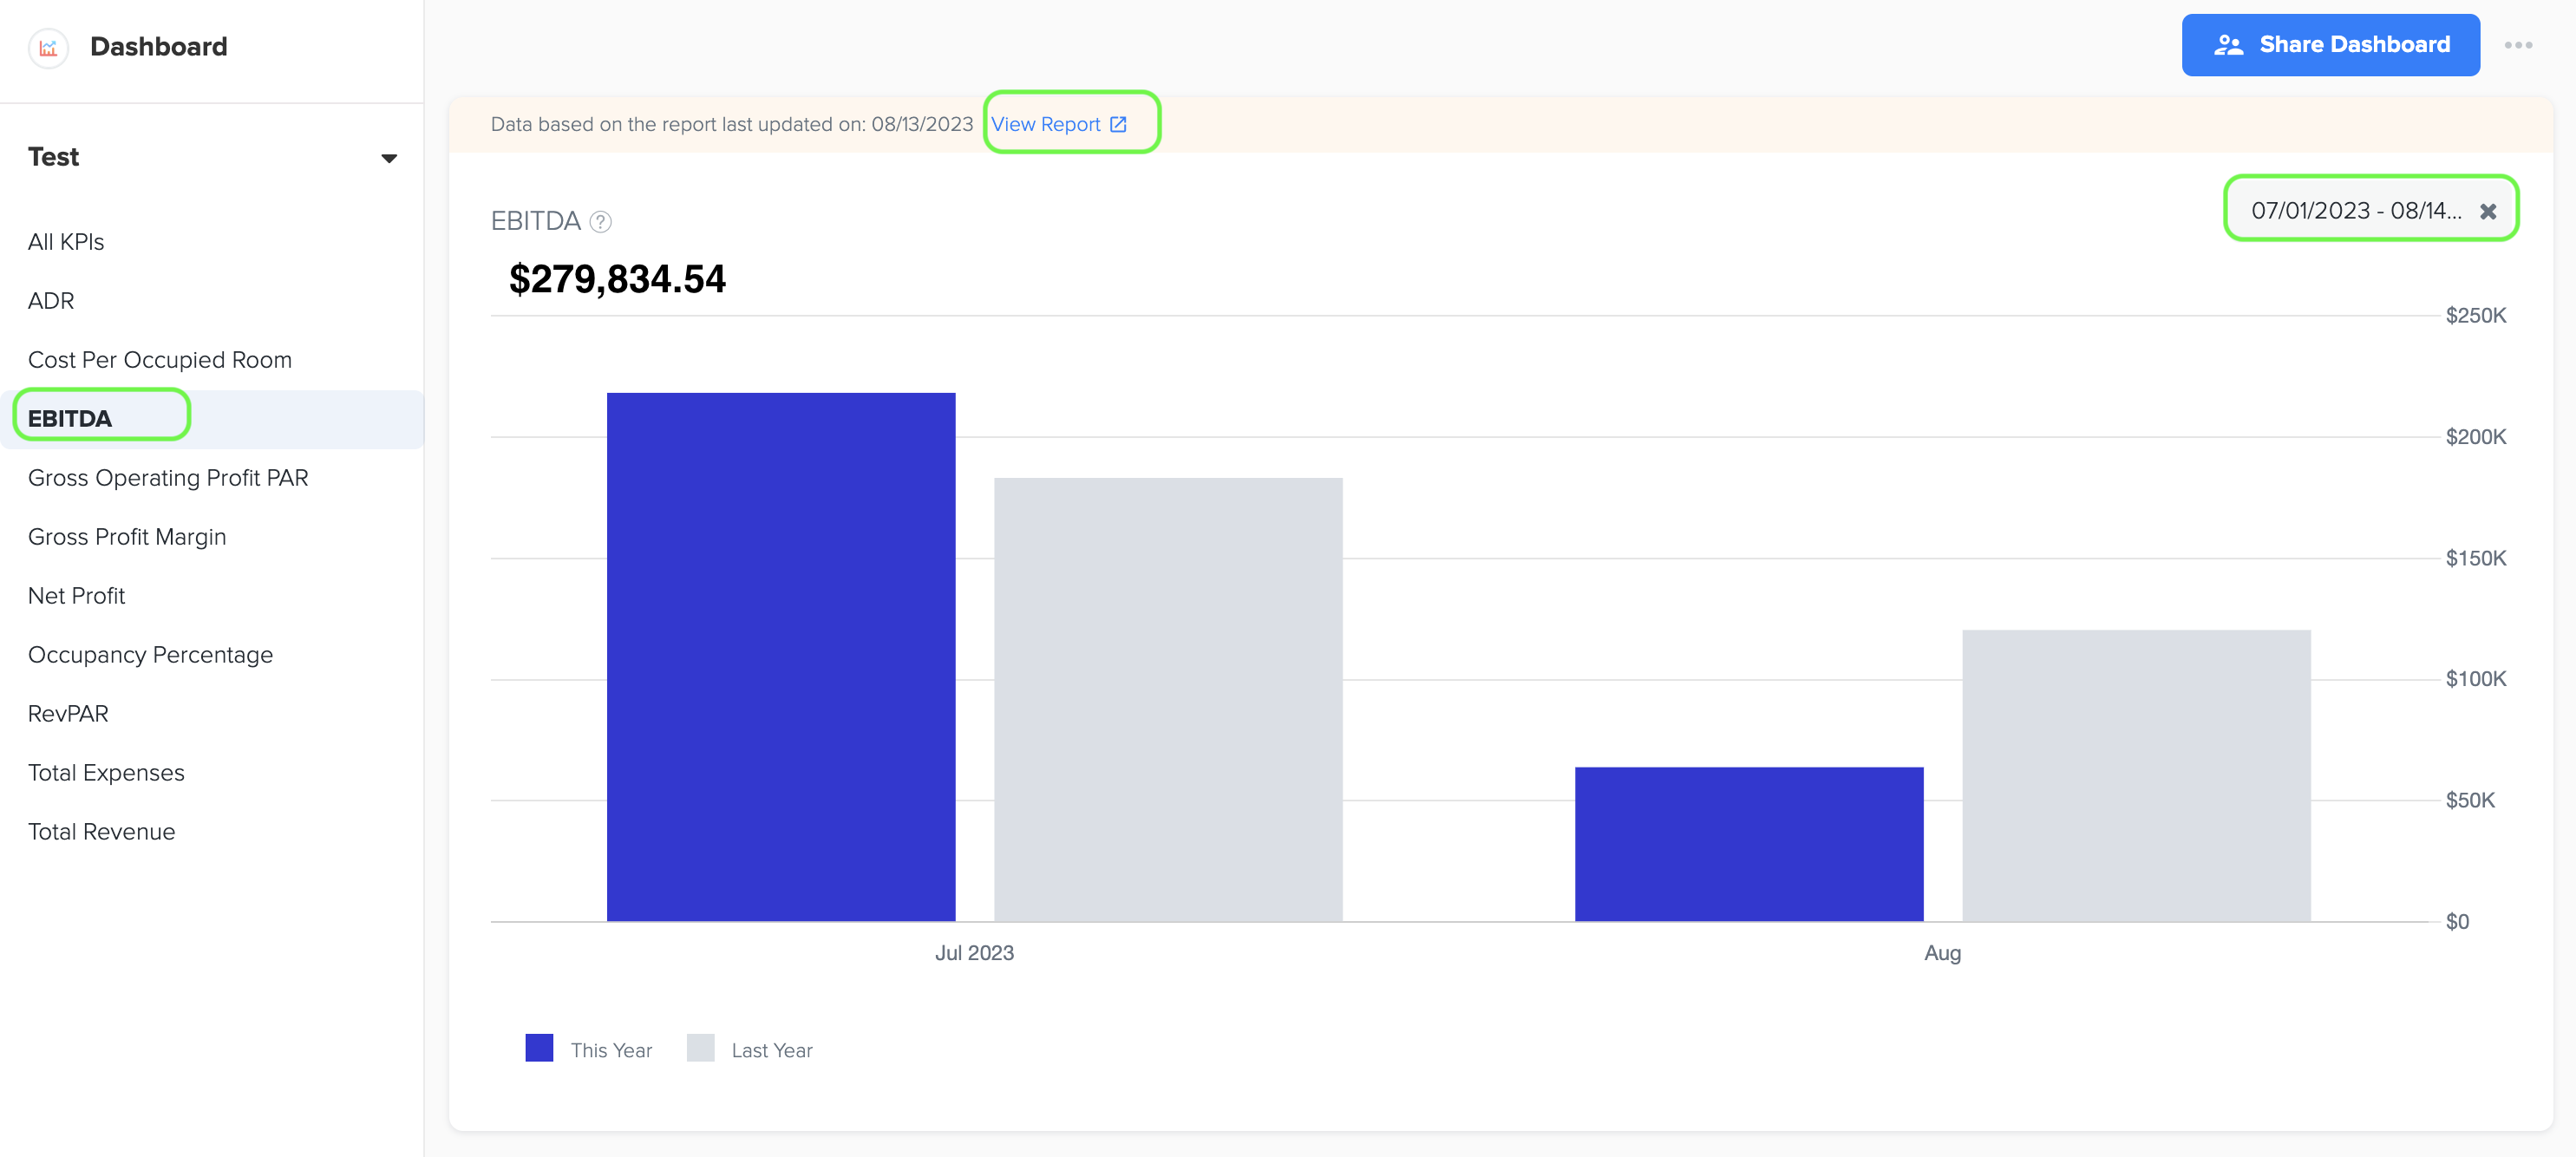
1. EBITDA, which stands for "Earnings Before Interest, Taxes, Depreciation, and Amortization," is a widely used financial metric to evaluate a company's operational performance and profitability. This metric provides valuable insights into the company's ability to generate earnings before accounting for interest, taxes, depreciation, and amortization expenses. By excluding these factors, EBITDA allows for a clearer assessment of the company's core operating profitability.
2. The data for EBITDA is sourced from the Owner's Operating Statement in the Management Report of Docyt, which provides valuable insights into a company's operational performance and profitability.
3. By excluding interest, taxes, depreciation, and amortization, EBITDA provides a clearer picture of a company's operational performance because it focuses on its ability to generate earnings from its core business activities, irrespective of its capital structure or accounting policies. EBITDA is often used to compare the financial performance of different companies, especially in industries where capital expenditures and debt levels vary significantly.
4. To view the bar graph that displays the EBITDA, simply navigate to the left menu and select the 'EBITDA' option. From there, you can easily choose the specific time period by selecting the start and end dates that you're interested in. Once you're on the graph page, click on the 'View Report' link to access a detailed report. This report will provide you with valuable information about the data source that was used to create the graph, giving you a better understanding of the EBITDA performance of your hotel.
10. Cost per Occupied Room
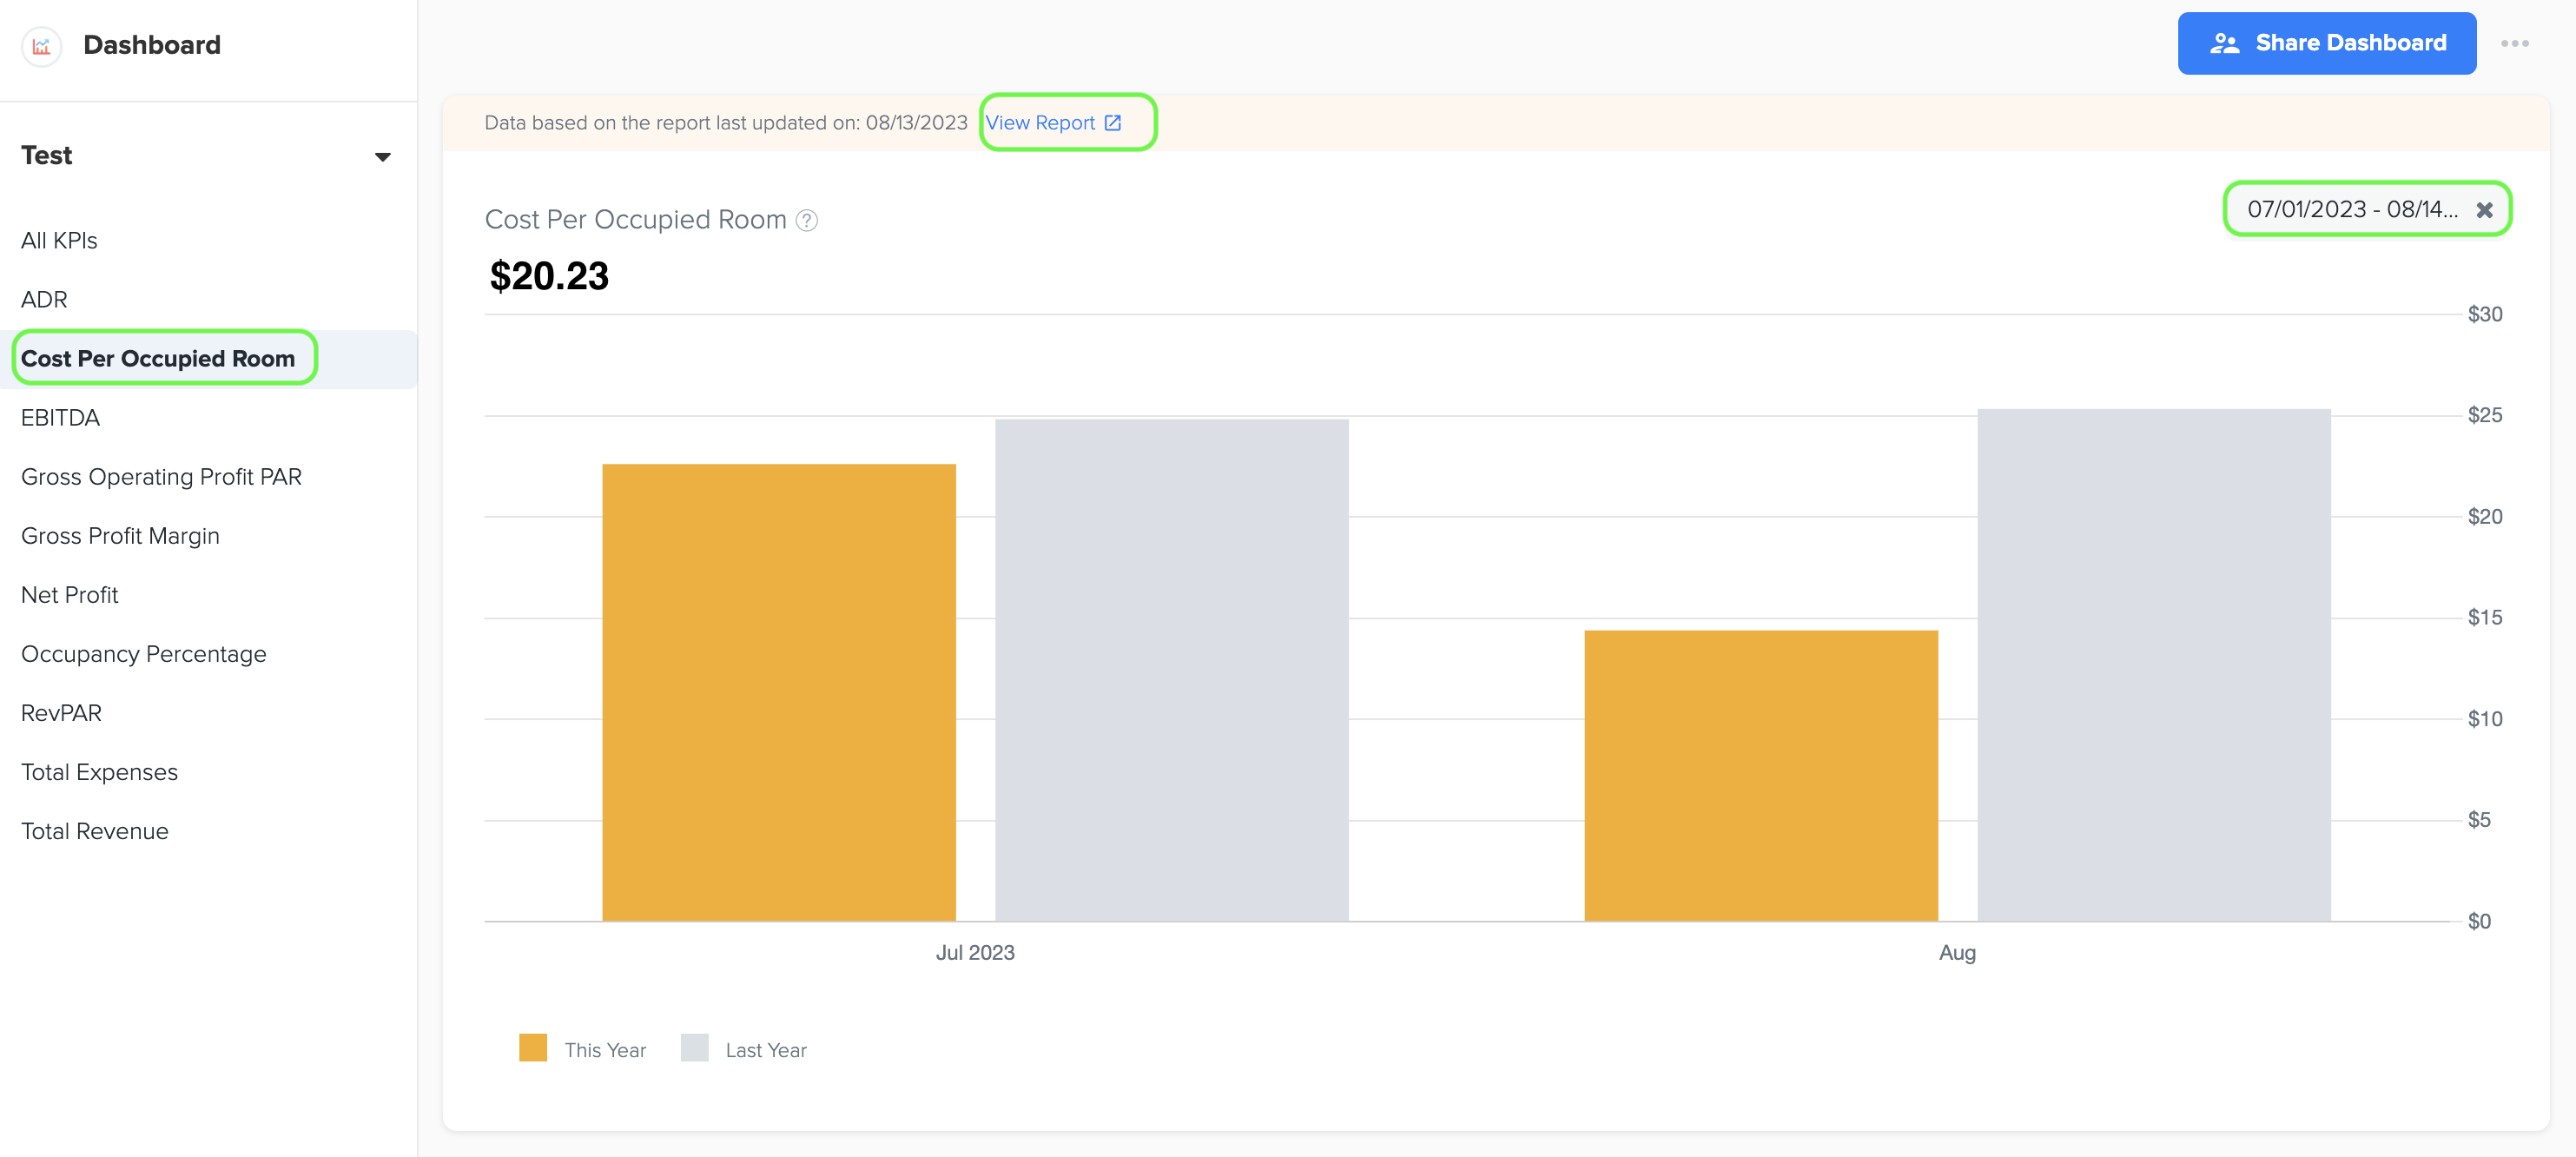
1. Cost per occupied room is a key performance indicator that measures the average cost a hospitality business incurs for each room that is occupied. This metric provides valuable insights into the efficiency of operations and resource allocation within the hotel, helping hoteliers understand the financial impact of occupancy on their overall costs. By analyzing the cost per occupied room, hotel operators can identify areas for improvement and make informed decisions to optimize their operations and maximize profitability.
2. Its formula is:
Cost per Occupied Room= Total Expenses for Room Department / Number of Rooms Sold.
3. Owner's Operating Statement is the source of data for both Room Expenses and Rooms Sold.
4. To view the bar graph that shows the cost per occupied room, simply go to the left menu and select the 'Cost per Occupied Room' option. You can easily choose the desired time period by selecting the start and end dates. Once you're on the graph page, click on the 'View Report' link to access a detailed report and see the data source used to create the graph. This will provide you with valuable information about the cost per occupied room and allow you to analyze the financial impact of occupancy on your hotel's overall costs.