
Docyt has identified following key performance indicator (KPI) metrics specifically for UPS store owners. These metrics are crucial in assessing the financial performance and success of a UPS store business:
1. Net Profit:
1. To access the dashboard, simply click on the 'Dashboard' option in the menu bar and choose the specific dashboard you want from the available options in the dropdown list. 
2. To access the bar graph displaying the Net Profit, simply click on the 'Net Profit' option on the left navigation menu. From there, you can also click on the 'View Report' link within the bar graph to open the detailed report and view the data source used to create the graph. The data used to create the graph comes from the Net Profit amount found in the Profit and Loss statement, which can be accessed under the Basic menu in the Business Reports section of Docyt.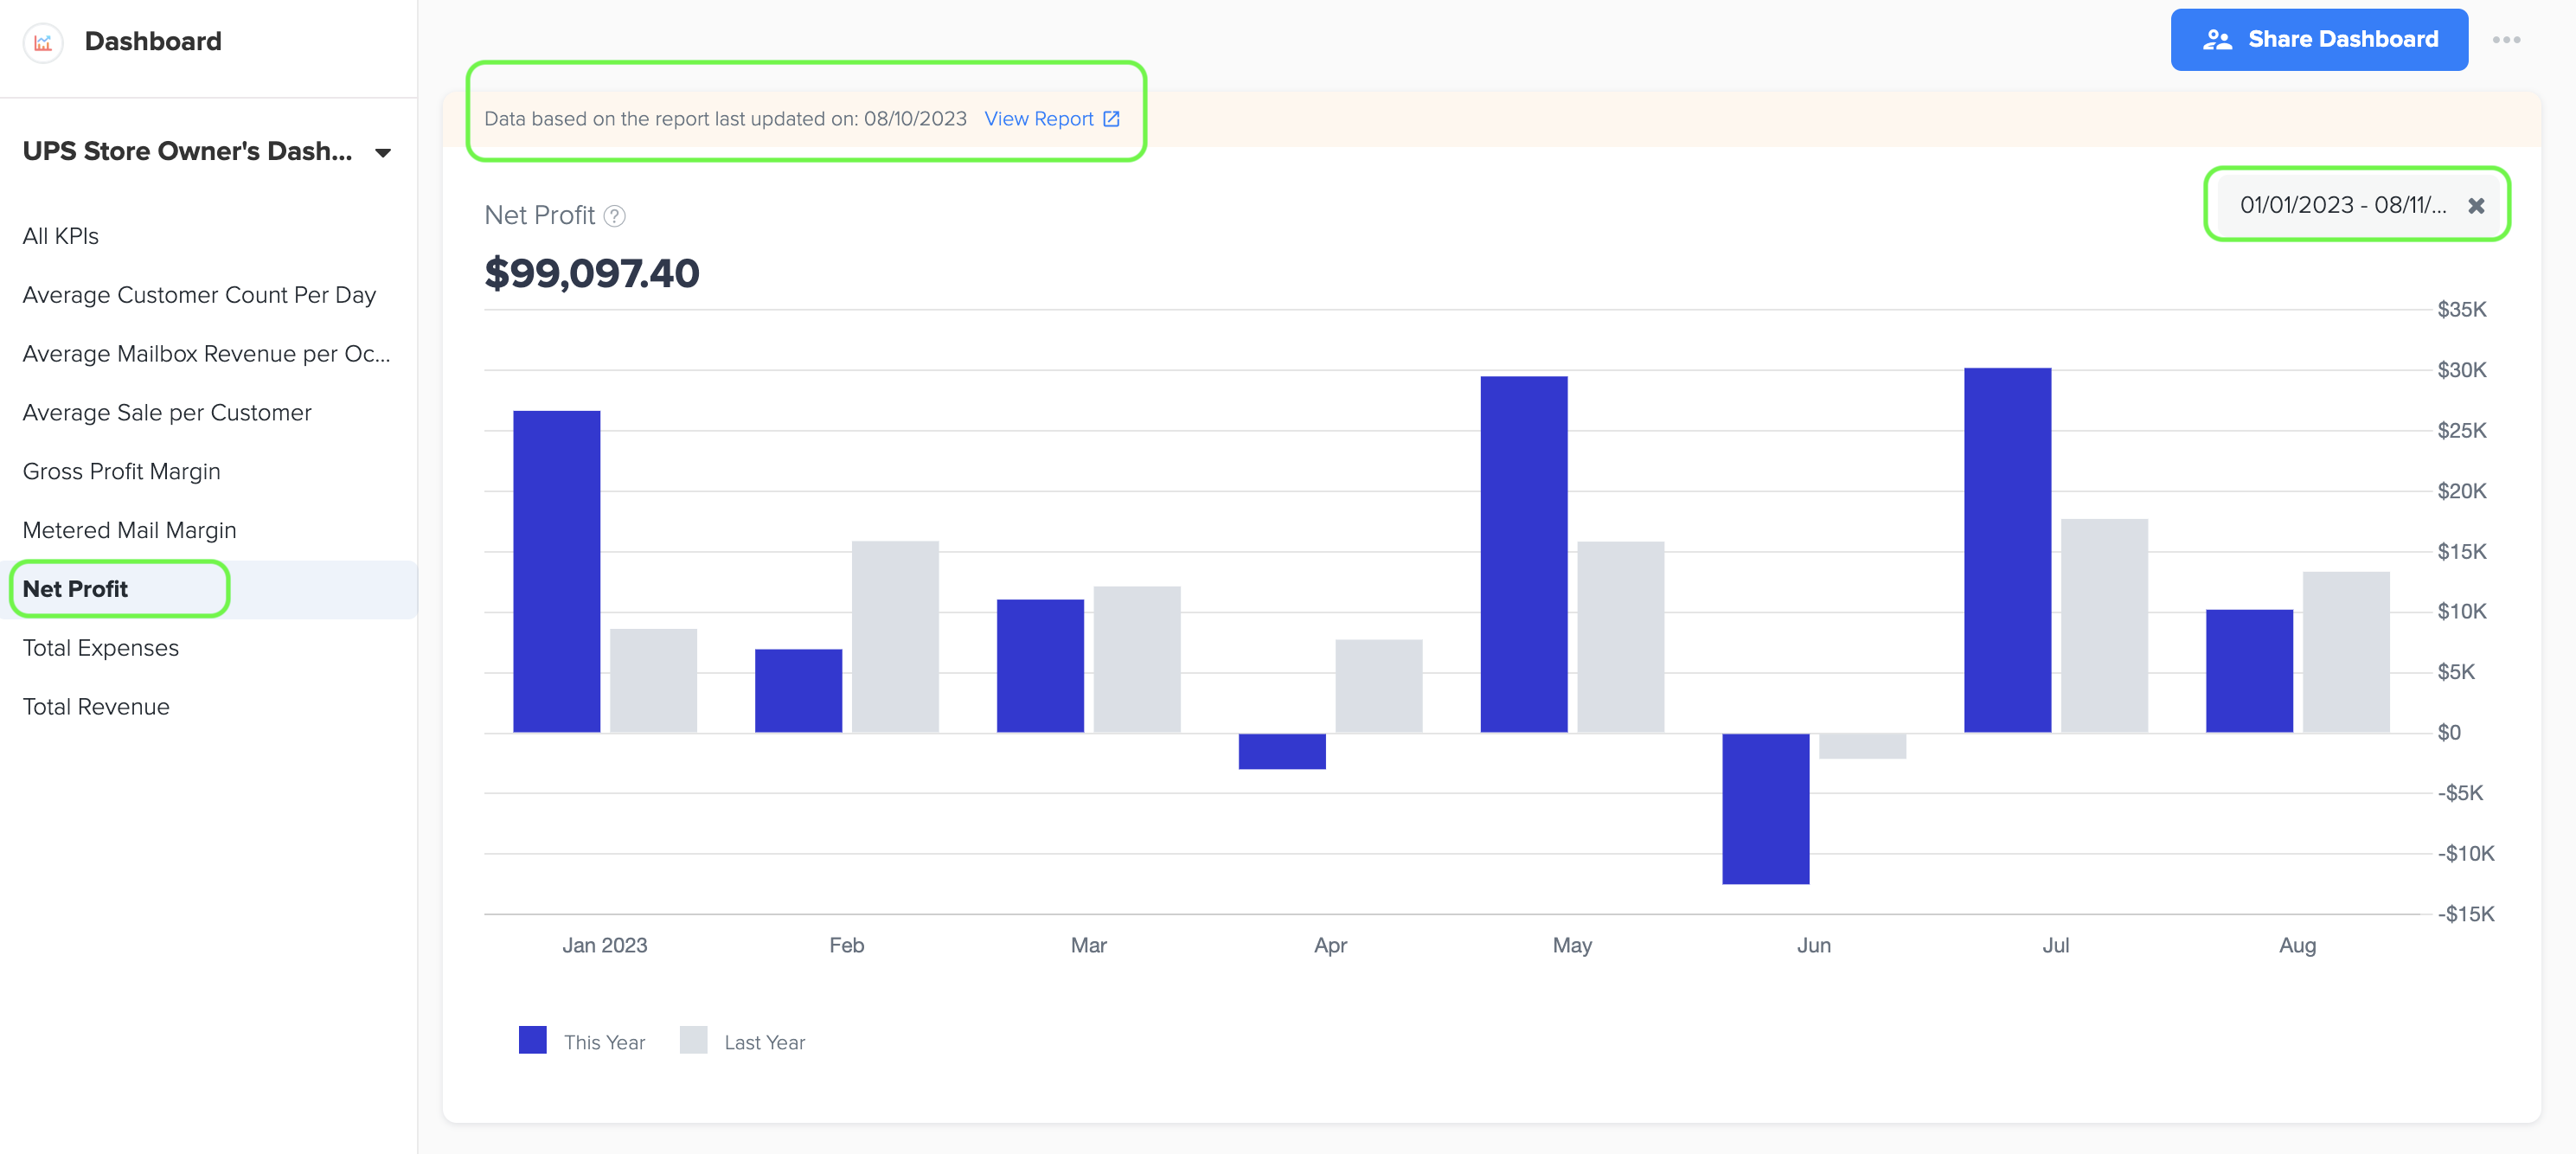
3. To plot the bar graph, simply select the desired time period by choosing the start and end date range.

4. To calculate the net profit before tax for a UPS Store, Docyt uses the following formula:
Net Profit Before Tax = Total Revenue - COGS - Total Expenses
Total Revenue represents the overall income generated by the UPS Store, including sales of products, services, and any other sources of revenue.
5. The Cost of Goods Sold (COGS) for a UPS Store typically includes the direct costs associated with providing the services and products offered by the store.
6. Total Expenses (Operating Expenses) include all the costs involved in operating the UPS Store, such as rent, utilities, employee wages, inventory costs, marketing expenses, and any other operating expenses.
7. By subtracting the Total Operating Expenses and COGS from the Total Revenue, you can determine the net profit before tax. This represents the amount of money the UPS Store has earned after deducting all expenses but before paying taxes.
8. The Net Profit KPI dashboard displays the Net Profit Amount on the Y-axis and the Month on the X-axis. It also includes a grey color bar that allows for a month-to-month comparison with the net profit amount from the previous year.
2. Total Expenses (Excluding COGS)
1. To view the bar graph that displays the Total Expenses, simply navigate to the left menu and select the 'Total Expenses' option.
2. To generate the bar graph, you can easily select the specific time period by choosing the start and end dates.
3. Once you're on the graph page, you can also click on the 'View Report' link to access a detailed report and see the data source used to create the graph.
4. The data for this graph is sourced from the Total Expenses amount found in the Profit and Loss statement, which can be found in the Basic menu under the Business Reports section of Docyt.
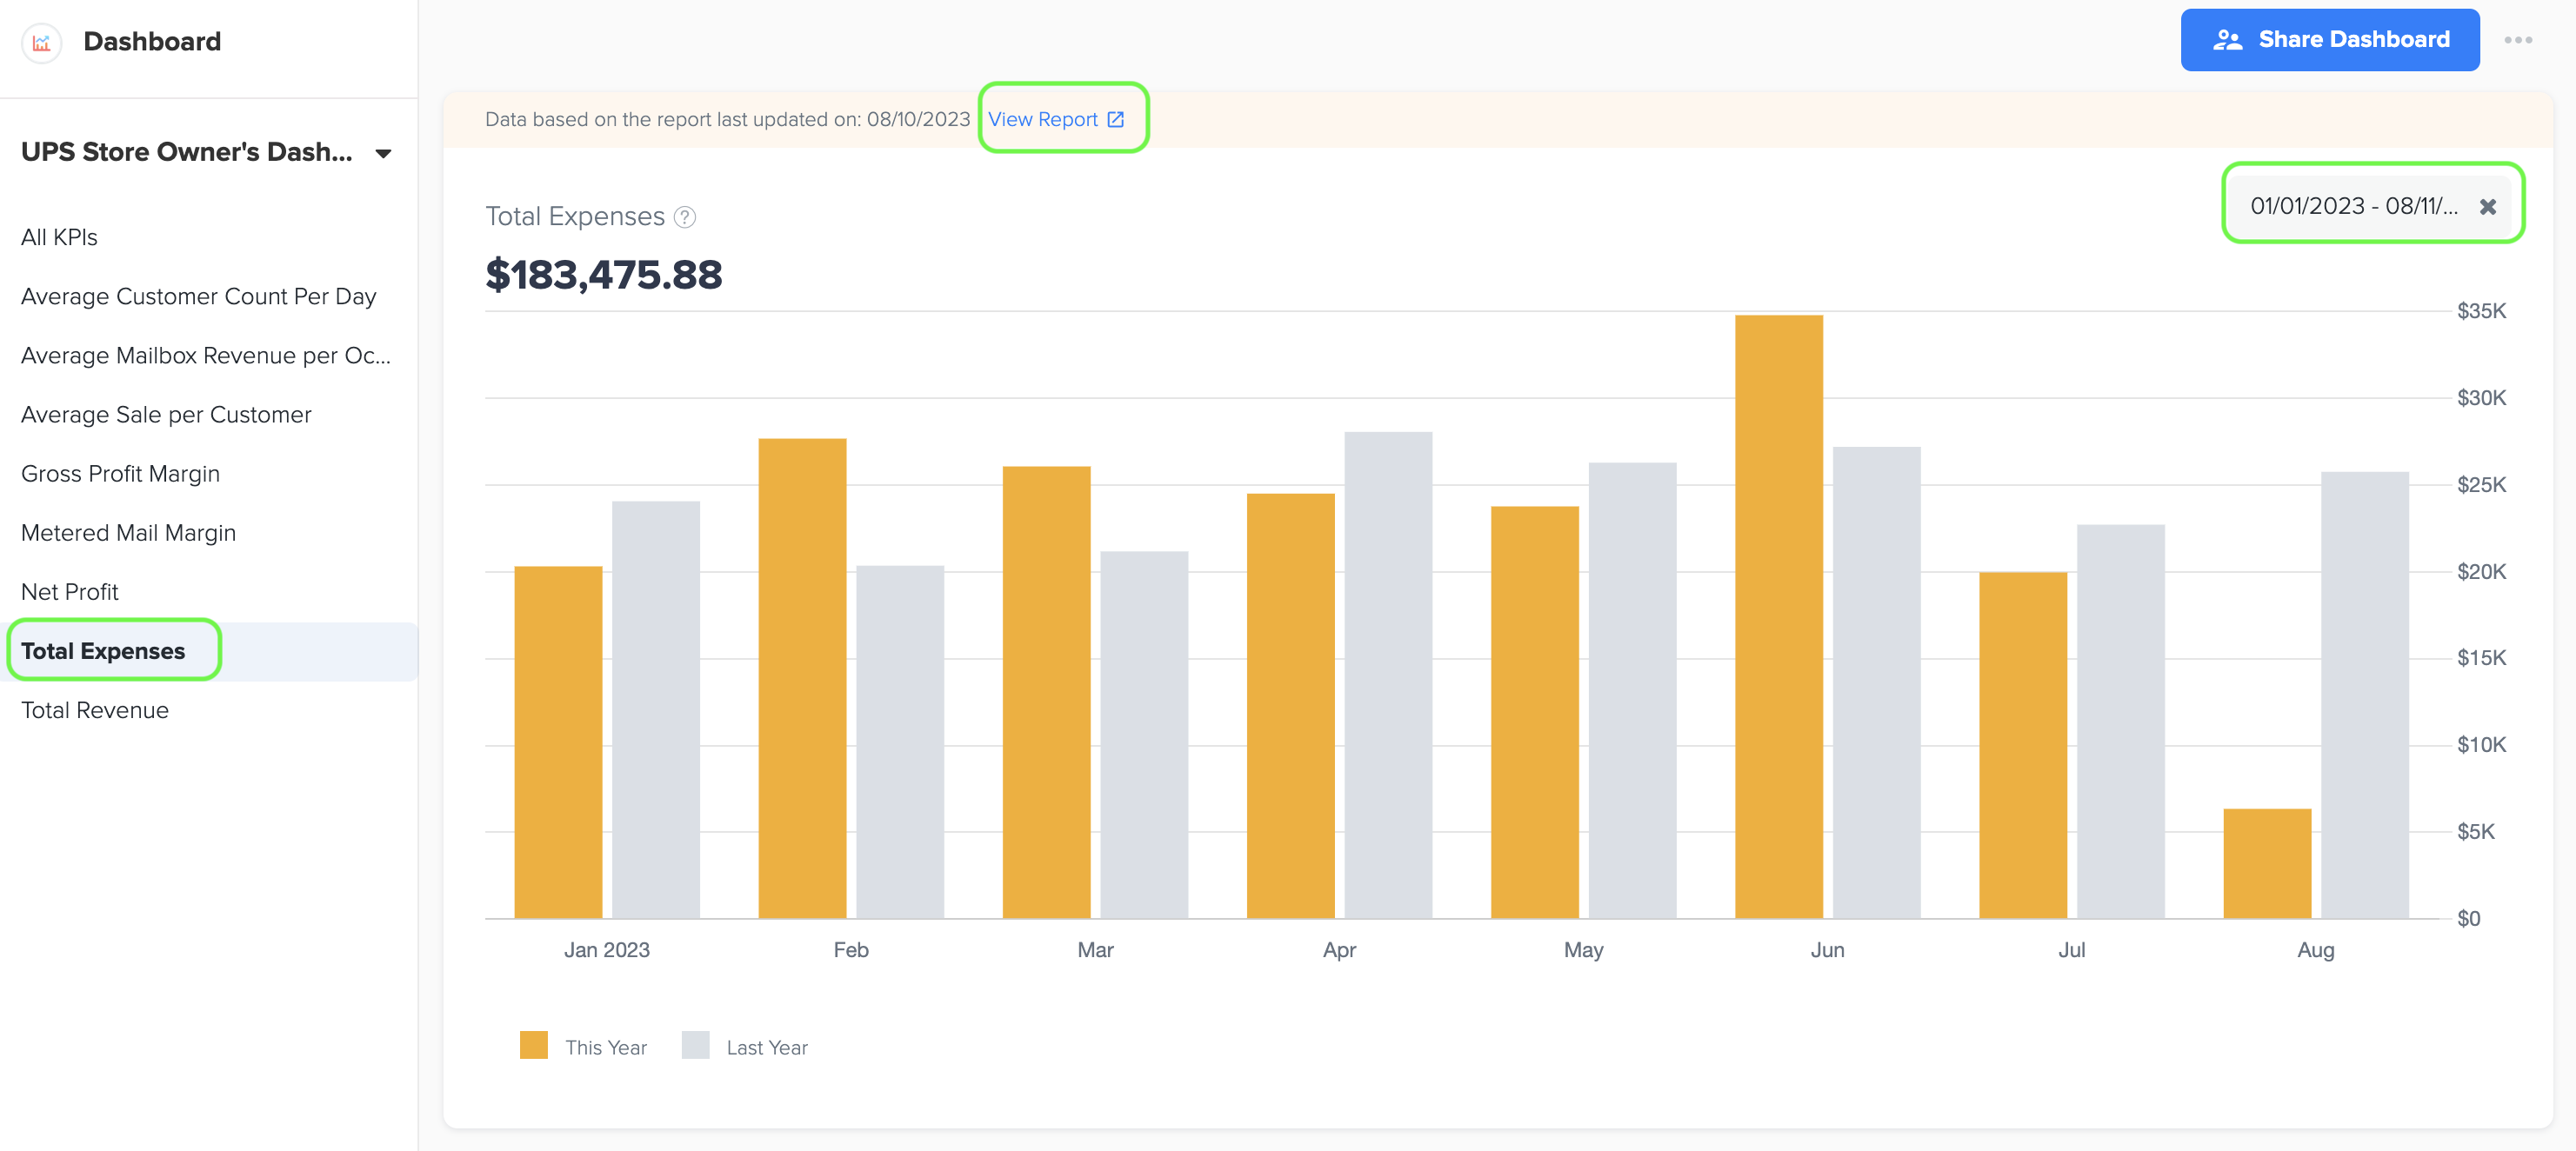
5. Total expenses in the context of a UPS Store refers to all the costs and expenditures involved in running the business, excluding the direct costs associated with the products or services offered. These expenses encompass various items such as rent, utilities, salaries and wages, marketing and advertising, general and administrative expenses, as well as maintenance and repairs.
6. By excluding the cost of goods sold (COGS), which represents the direct costs related to the goods or services being sold, this definition specifically focuses on the operational expenses necessary to operate the UPS Store. These expenses are crucial for maintaining the store's operations, supporting the staff, promoting the business, and managing the overall administrative aspects of the store.
3. Total Revenue
1. To view the bar graph that displays the Total Revenue, simply navigate to the left menu and select the 'Total Revenue' option.
2. To generate the bar graph, you can easily select the specific time period by choosing the start and end dates.
3. Once you're on the graph page, click on the 'View Report' link to access a detailed report and see the data source used to create the graph.
4. The data for this graph is sourced from the Total Income amount found in the Profit and Loss statement, which can be found in the Basic menu under the Business Reports section of Docyt.
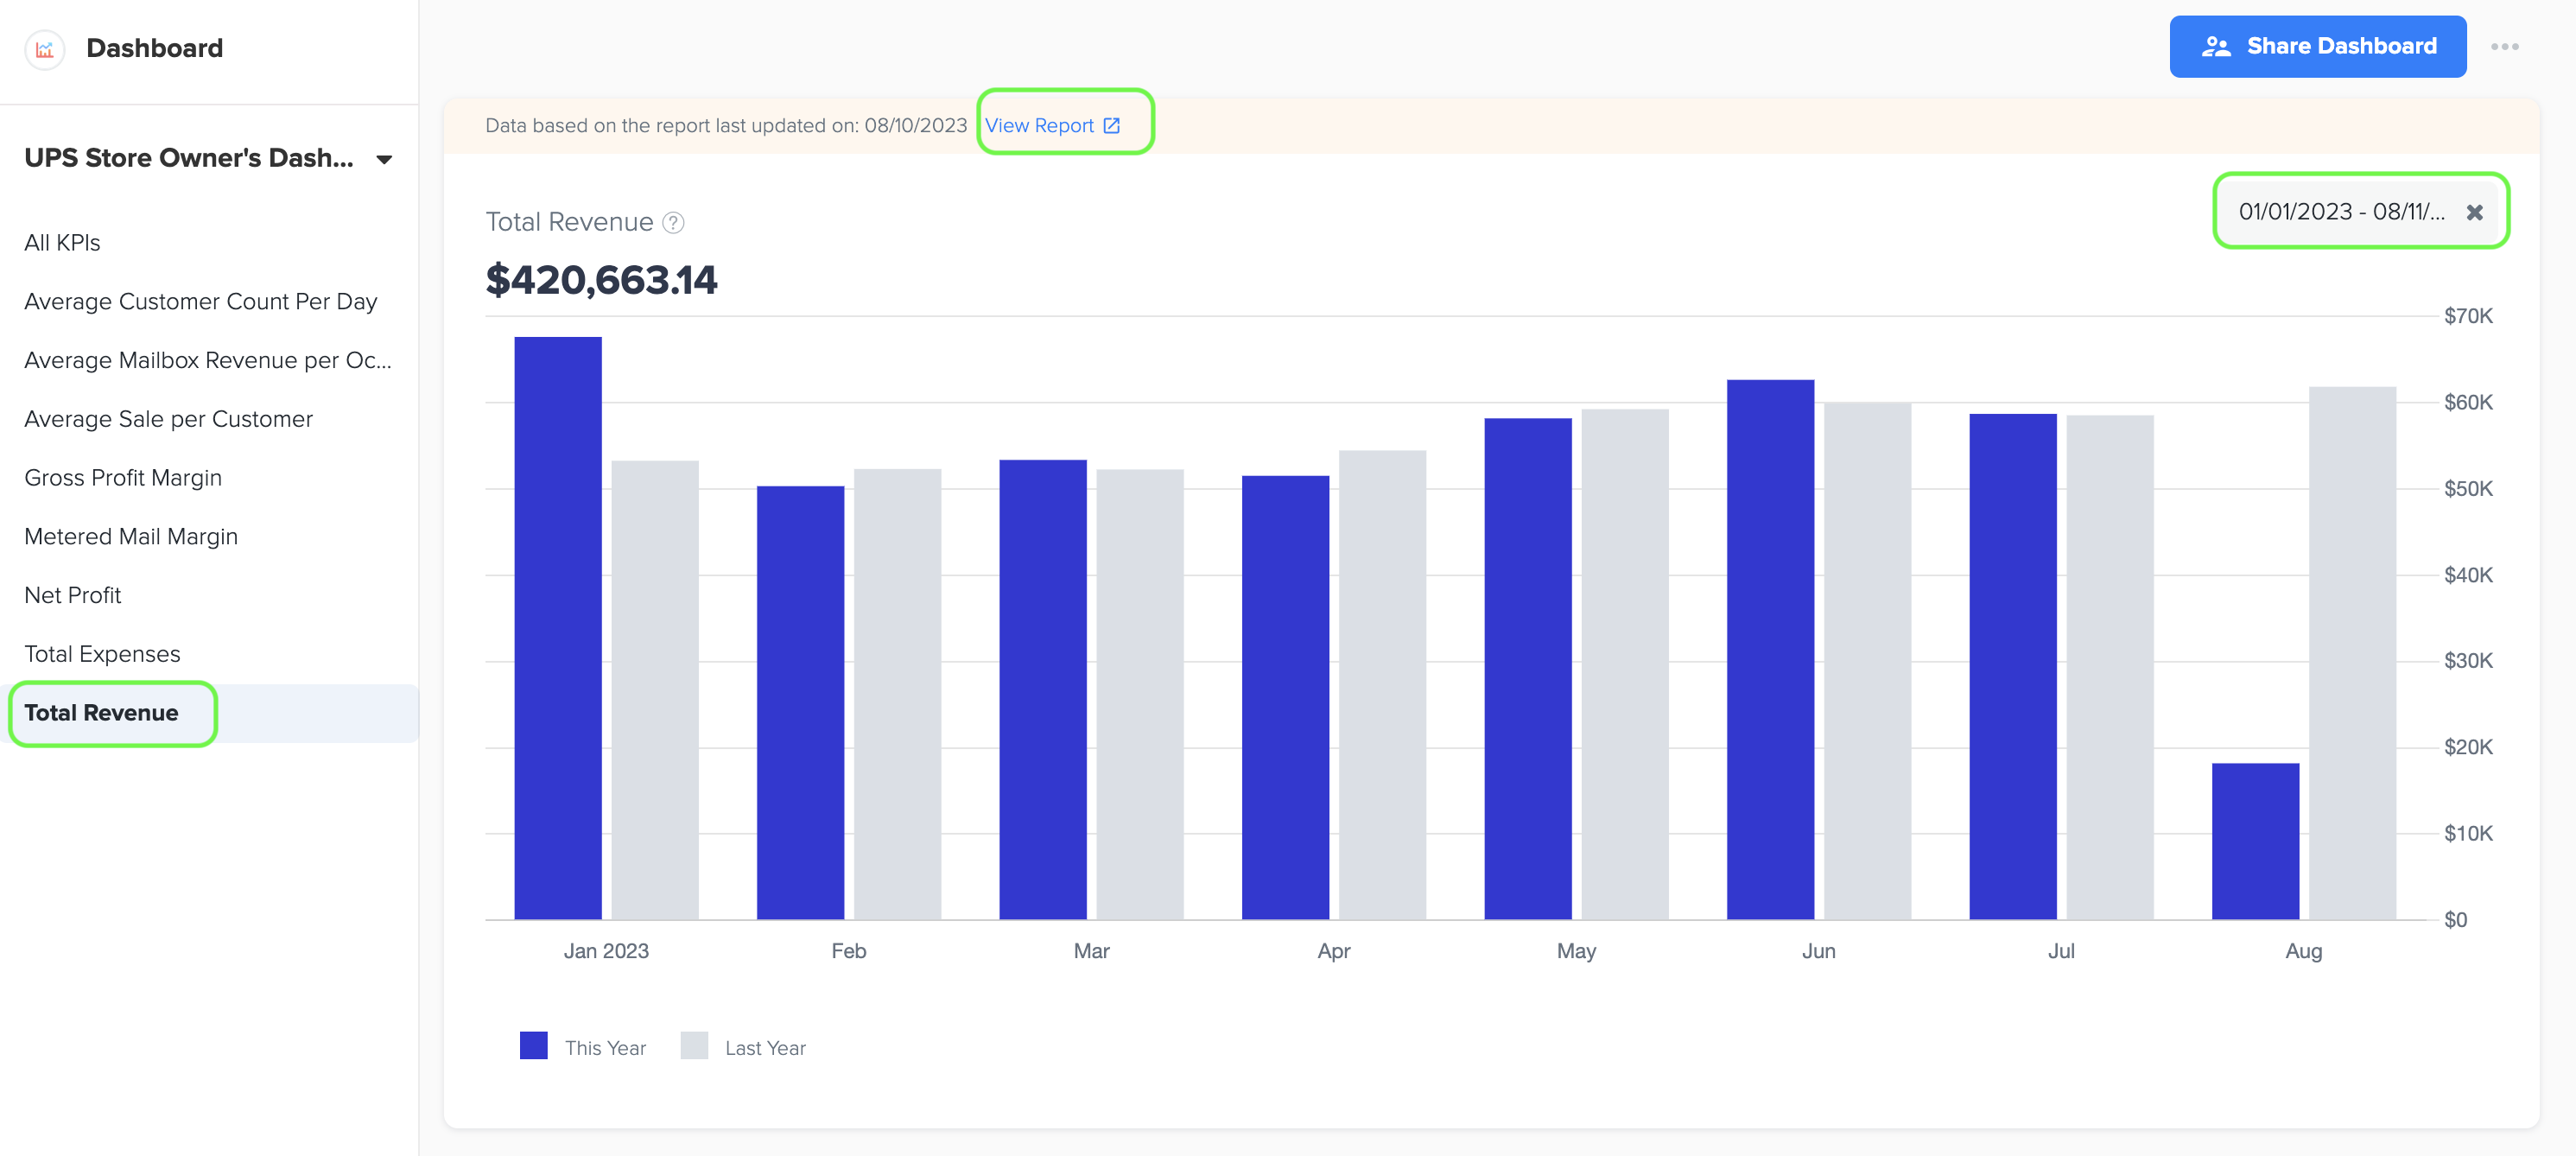
5. The term "Total Revenue" refers to the overall income or sales generated by a business from its operations during a specific period. In the context of a UPS Store, total revenue represents the sum of all the money received by the store from various sources, such as shipping and packaging services, printing and copying services, mailbox rentals, and sales of retail items etc.
4. Gross Profit Margin (%)
1. To view the line graph that displays the Gross Profit Margin (%), simply navigate to the left menu and select the 'Gross Profit Margin' option.
2. To generate the line graph, you can easily select the specific time period by choosing the start and end dates.
3. Once you're on the graph page, click on the 'View Report' link to access a detailed report and see the data source used to create the graph.
4. The data for this line graph is sourced from the Owners Report in the Management Report under the Business Reports section of Docyt. It includes the Total Gross Profit on AGS Sales and Total AGS (Adjusted Gross Sales) data.
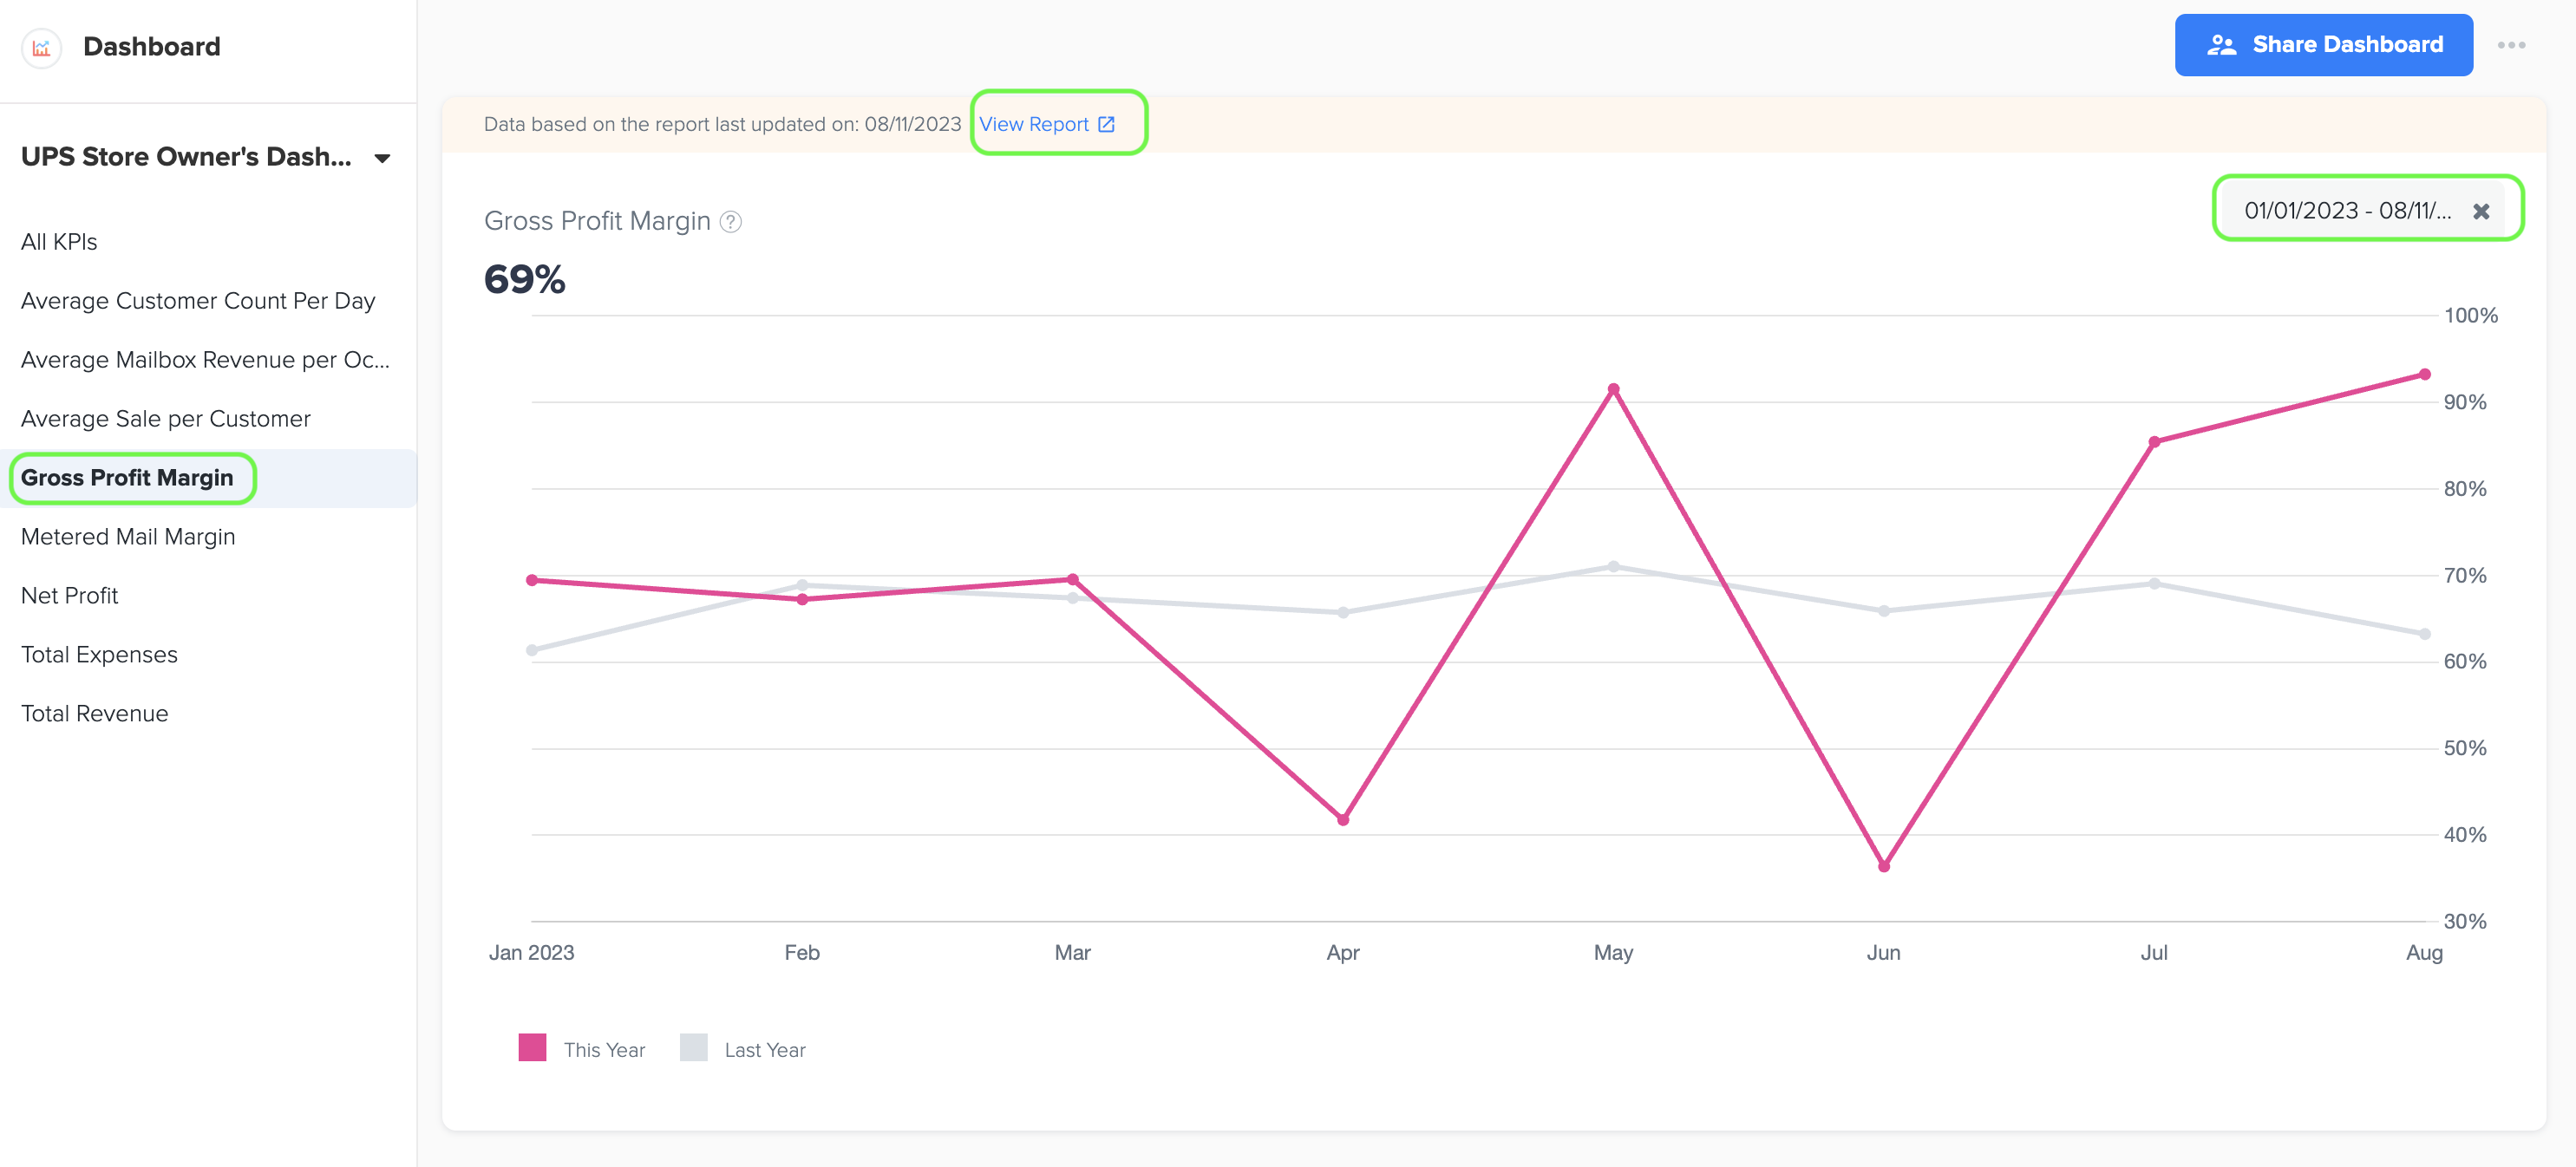
5. Gross profit margin is a financial metric used to assess a company's profitability and efficiency in generating revenue from its core operations. It represents the percentage of revenue that remains after subtracting the Cost of Goods Sold (COGS). The formula for calculating gross profit margin is as follows:
Gross Profit Margin (%) = (Gross Profit / Total Revenue) x 100
where, Gross Profit=Total Revenue - Cost of Goods Sold. Multiplying the result by 100 converts it to a percentage.
6. Gross Profit is determined by deducting the Cost of Goods Sold (COGS) from the Total Revenue. The Total Revenue represents the total income generated by the UPS store from various sources, including shipping services, packing materials, printing services, mailbox rentals, and other related services provided by the store.
7. COGS encompasses the specific expenses directly linked to the provision of goods or services at a UPS store. This includes costs related to purchasing shipping supplies, printing materials, packaging materials, shipping fees, and any other expenses directly associated with offering the services provided by the store.
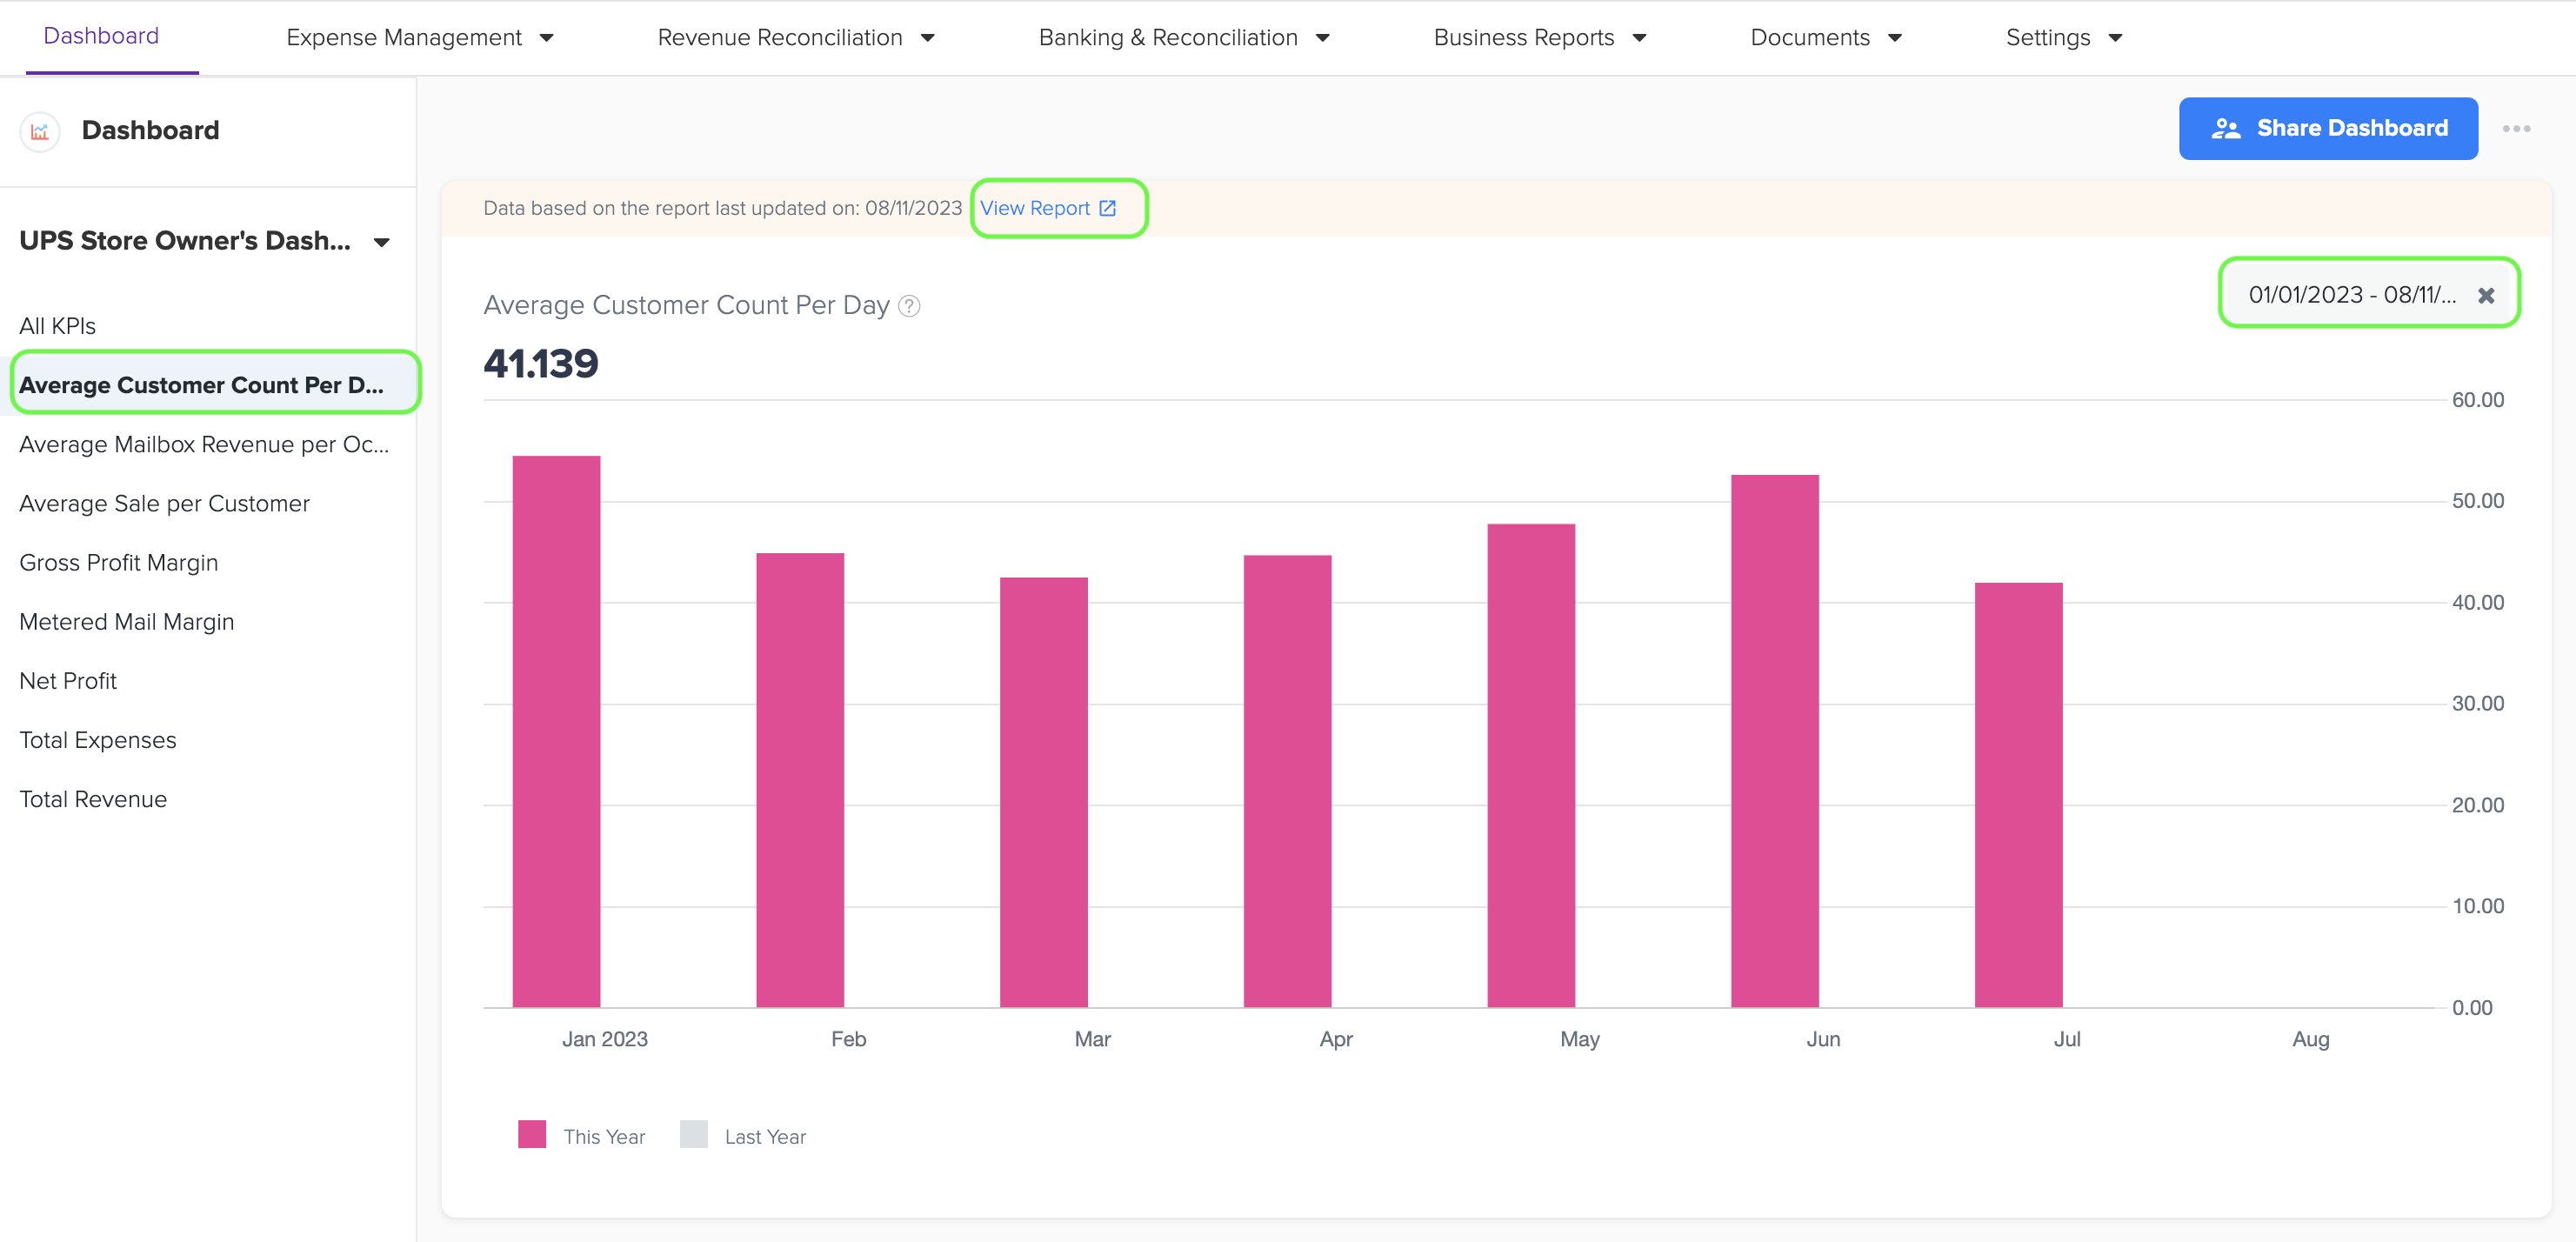
5. Average Customer Count Per Day (Average Customer Count per day in the month)
1. To view the bar graph that displays the Average Customer Count per day in the month, simply navigate to the left menu and select the 'Average Customer Count Per Day' option.
2. To generate the bar graph, you can easily select the specific time period by choosing the start and end dates.
3. Once you are on the graph page, simply click on the 'View Report' link to access the Owner's report and view the data source that was used to create the graph.
4. The customer count data for this metric is obtained from the Customer Count in Industry metrics, which can be found under the Business Reports menu in Docyt.
5. The formula for Average Customer Count per Day is:
Avg. Customer Count= Total Customers who visited business in a Month / No. of Days in Month.
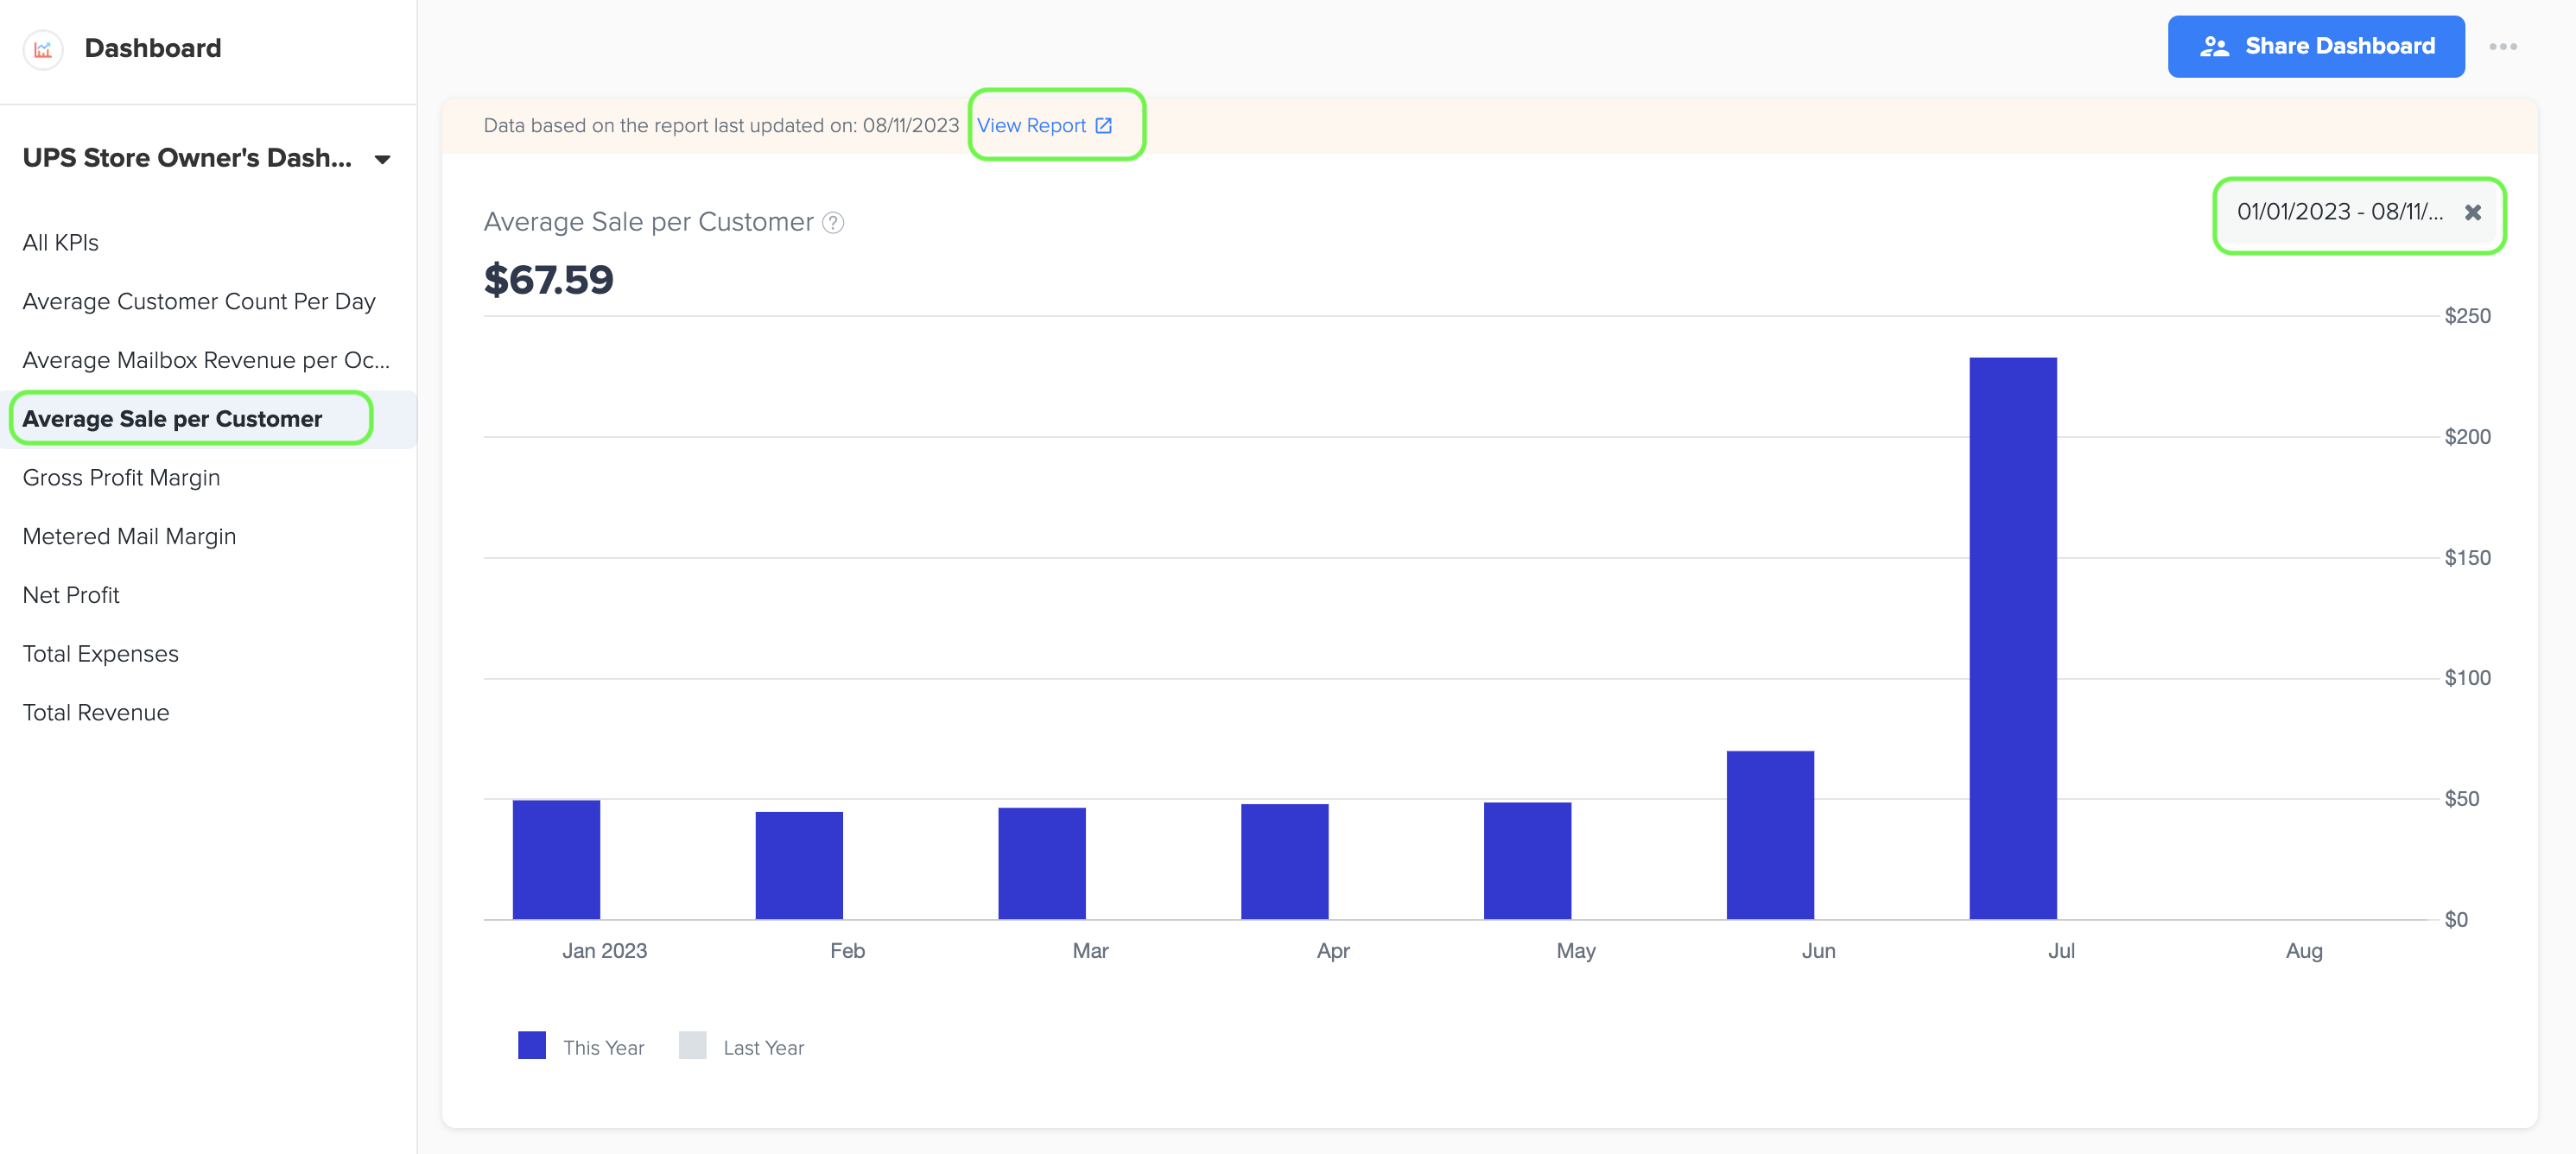
6. Average Sales Per Customer
1. To view the bar graph that displays the Average Sales per Customer, simply navigate to the left menu and select the 'Average Sales per Customer' option.
2. To generate the bar graph, you can easily select the specific time period by choosing the start and end dates.
3. Once you are on the graph page, simply click on the 'View Report' link to access the Owner's report and view the data source that was used to create the graph.
4. The formula for calculating the average sales per customer in a month is:
Average Sales per Customer = Total Sales Revenue / Total Number of Customers
5. Total Sales Revenue represents the sum of all sales made in a given month, including the sales from different customers. The data source for Total sales revenue is Owner’s Report which contains the Adjusted Gross Sales (AGS) amount.
6. Total Number of Customers refers to the count of customers who made purchases or transactions during the same month. The data source for the Total number of Customers is Customer Count data in the Industry metrics menu under Business Reports in Docyt.
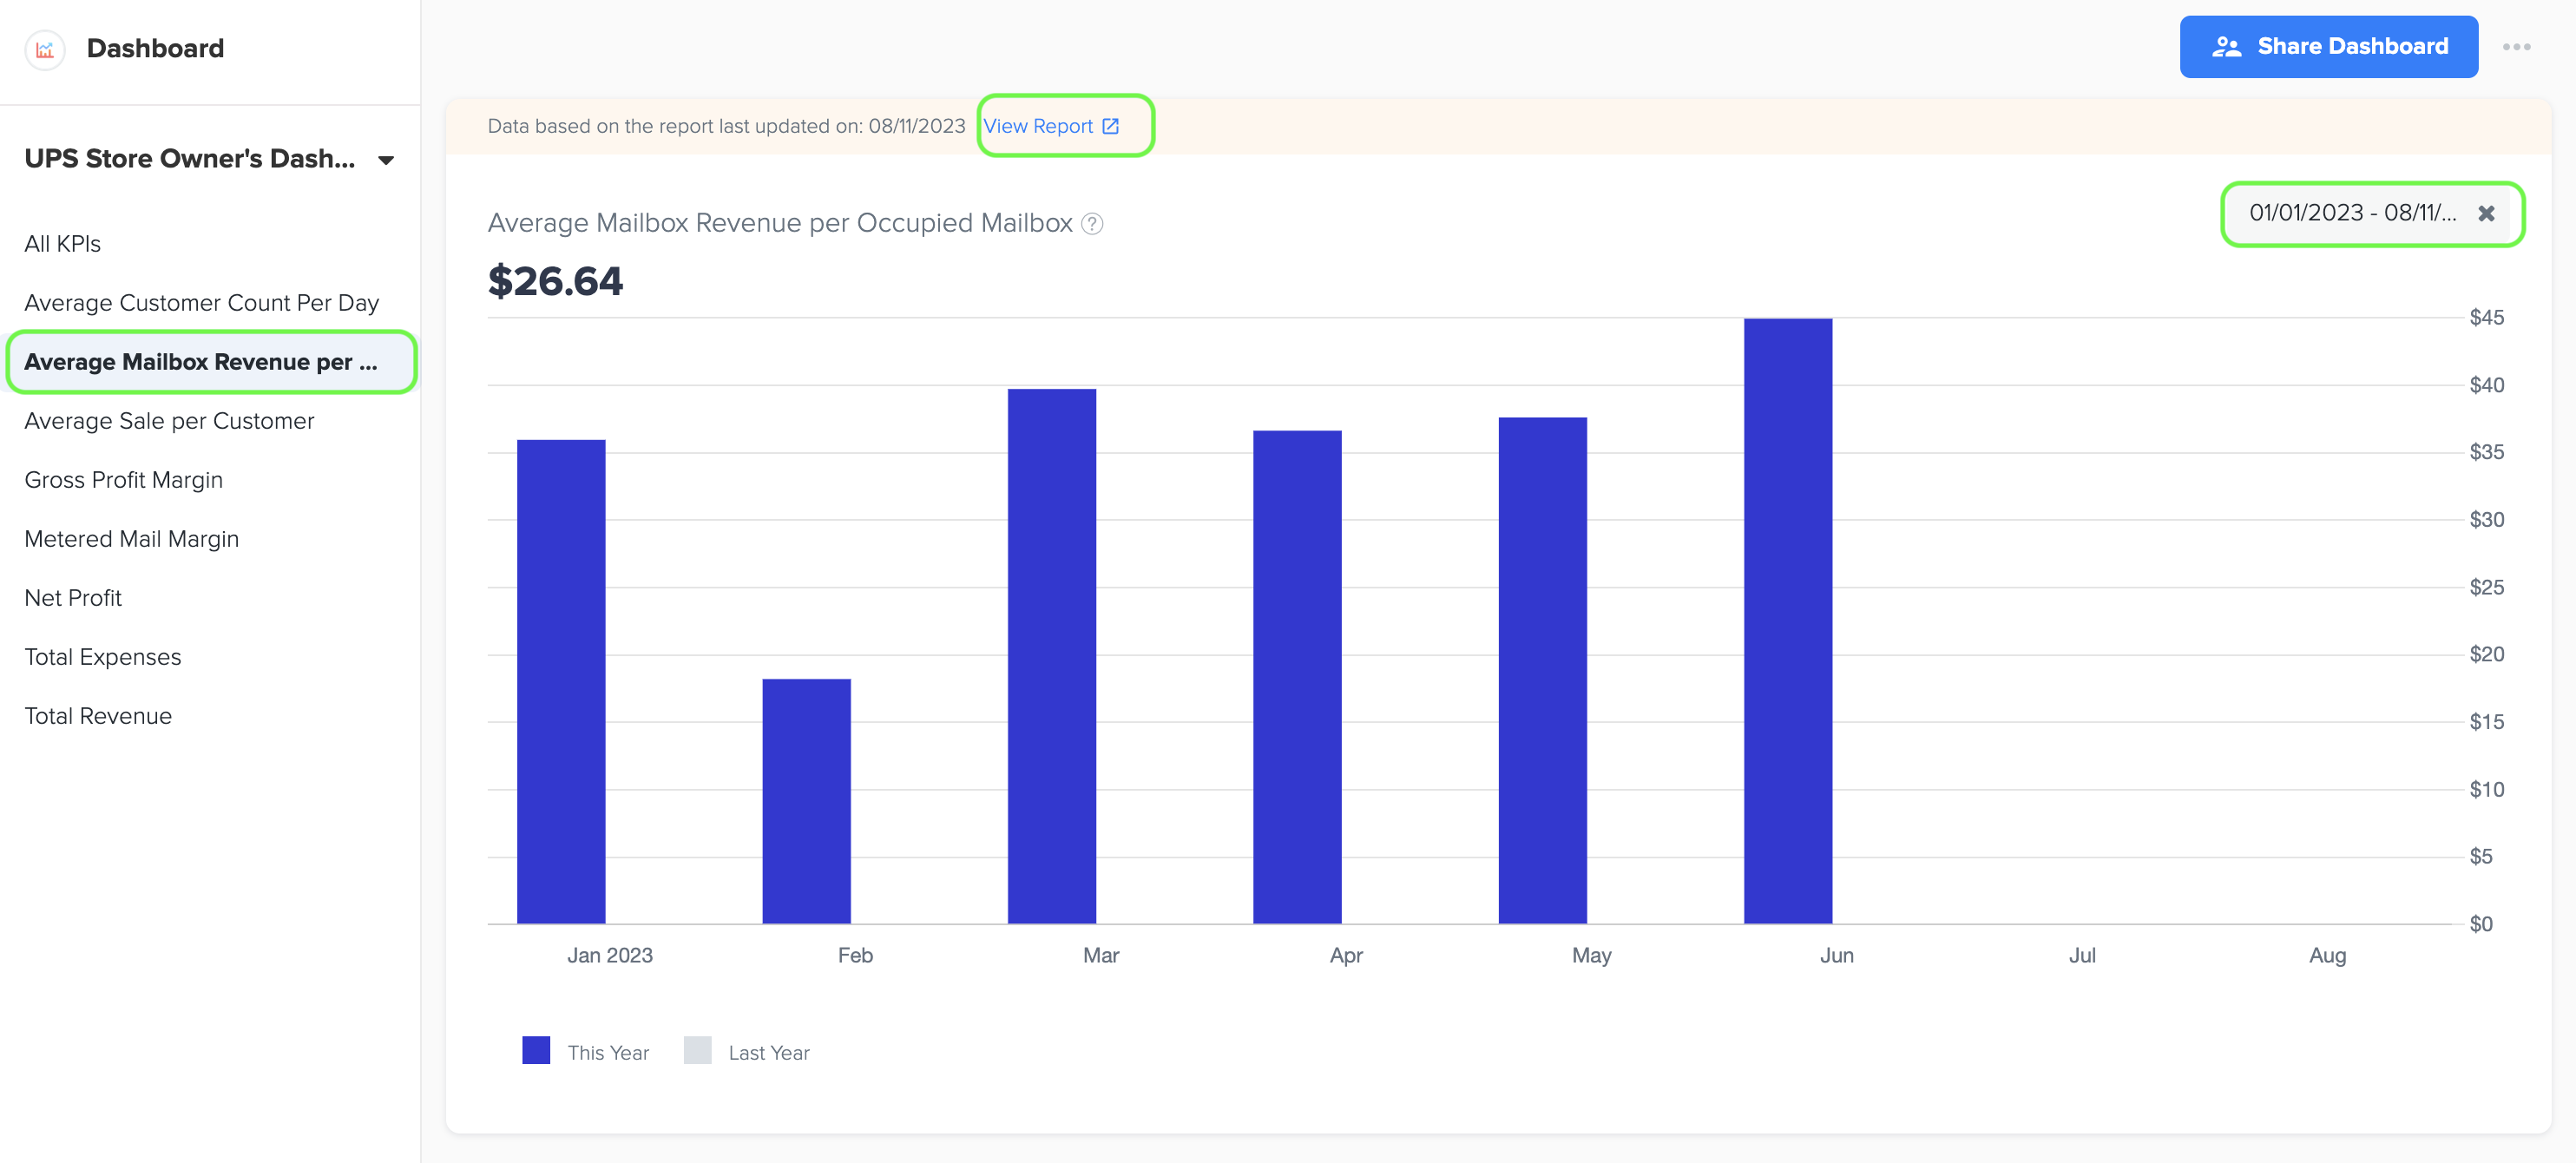
7. Average Mailbox Revenue per Occupied Mailbox
1. The average mailbox revenue per occupied mailbox measures the average revenue generated from each occupied mailbox, indicating the effectiveness of mailbox rentals and resource utilization.
2. The formula is:
Mailbox revenue per occupied mailbox= Mailbox Service Sales / Number of Occupied mailboxes.
3.The data source for Mailbox revenue is Mailbox service sales under the owner's report (Management report). Number of Occupied mailboxes data is obtained from Industry metrics.
4. To view the bar graph, simply navigate to the left menu and select the 'Average Mailbox Revenue per Occupied Mailbox' option. You can easily select a specific time period by choosing the start and end dates.
5. Once you are on the graph page, simply click on the 'View Report' link to access the Owner's report and view the data source that was used to create the graph.
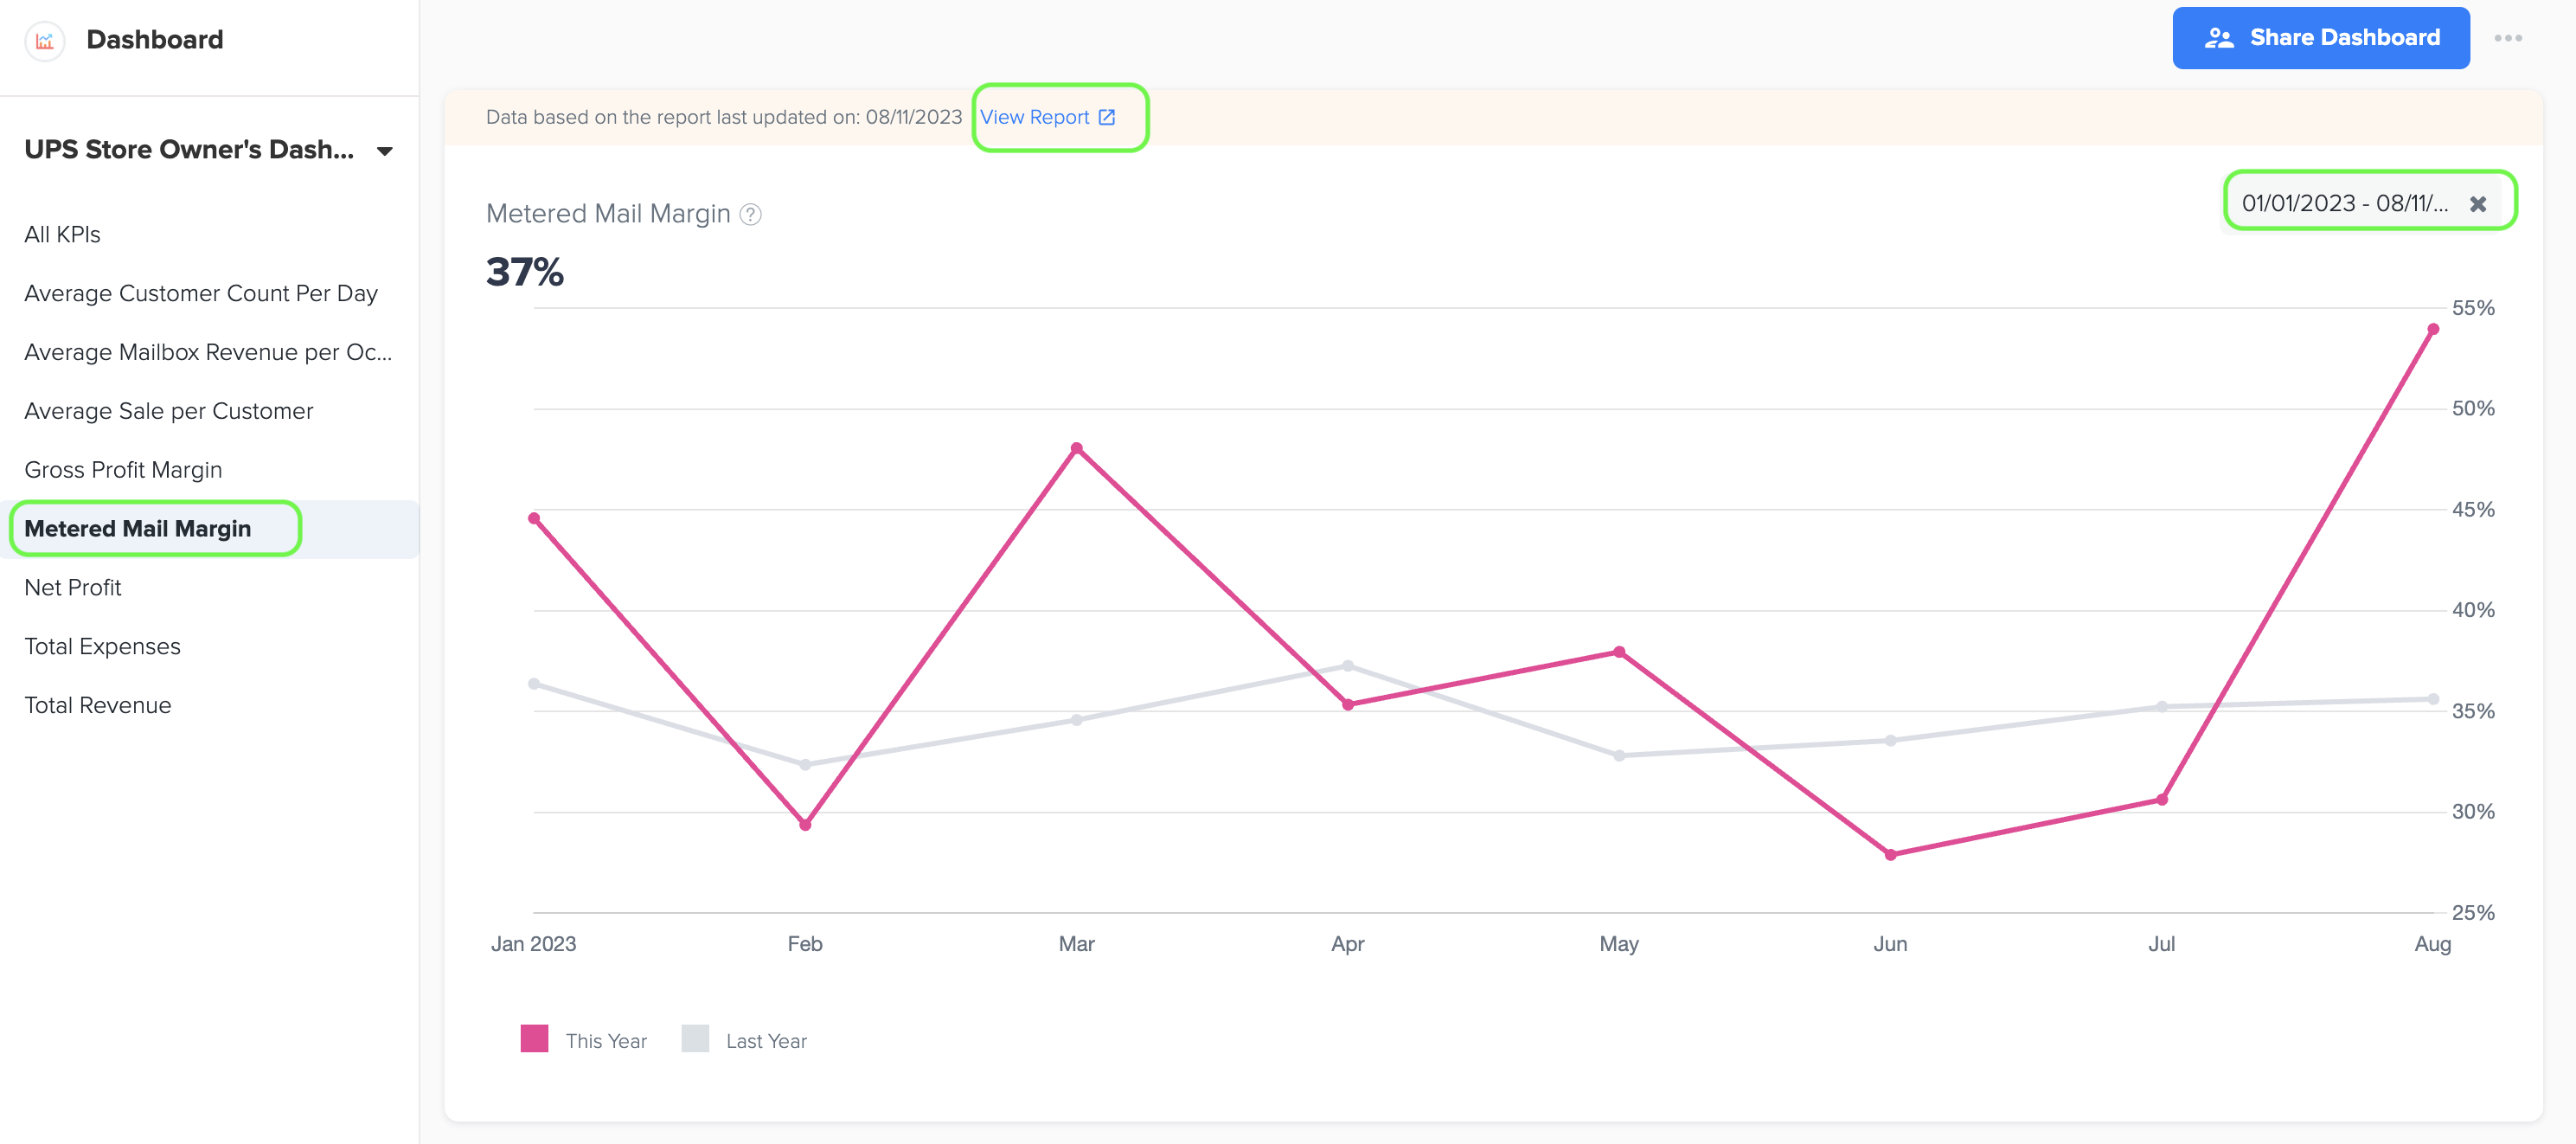
8. Metered Mail Margin (%)
1. The metered mail margin refers to the profit margin earned on metered mail services, calculated by dividing the cost of providing metered mail by the revenue generated by offering this service.
2. The formula is:
Metered Mail Margin (%)= (Metered mail COGS/ Metered mail Revenue) x 100
Multiplying the result by 100 converts it to a percentage.
3. The data source for metered mail cost and metered mail revenue (sales) is owner’s report (Management Report).
4. To view the line graph, simply navigate to the left menu and select the 'Metered Mail Margin' option. You can easily select the specific time period by choosing the start and end dates.
5. Once you are on the graph page, simply click on the 'View Report' link to access the Owner's report and view the data source that was used to create the graph.
9. Percentage of mailboxes occupied
How to View the Percentage of Mailboxes Occupied
-
Navigate to the Metric:
- Go to the left menu and select the 'Mailbox Occupancy' option.
-
Select Time Period:
- Choose the specific time period by selecting the start and end dates.
-
Generate the Line Chart:
- Once on the chart page, click on the 'View Report' link to access a detailed report and see the data source used to create the chart.
-
Data Source:
- The data for this chart is sourced from the ratio of Occupied Mailboxes to Total Mailboxes, which can be found in the Advanced Reports section of Docyt.
-
Definition:
- The term "Percentage of Mailboxes Occupied" refers to the proportion of mailboxes that are currently in use compared to the total number of mailboxes available. This metric helps you understand the utilization rate of mailbox resources over a selected period.