QSR Balance Sheet
Empowering Quick Service Restaurants: Leveraging Asset, Liability, and Equity Insights for Strategic Decisions
Table of Contents
- Accessing the Report
- Excel or PDF Format Export
- Report Components and Sections
- Benefits
- Troubleshooting Inaccurate Data
How to Access
- Sign in to your Docyt account.
- From the top navigation menu, click on 'Business Reports'. Choose 'Management Report' from the menu.

- On the 'Management Report' page, click 'QSR Balance Sheet'.

- Set report parameters like period and revenue sources. You will also notice a 'Total' column in the Balance Sheet Reports, which displays the combined value for all the months.

- You will also click on the each cell Example- "Account receivable" to see all/total transactions between jan to march as shown in the image.

- Generate the report for in-depth financial insights.
To export your report to Excel or PDF format
-
- Generate and review the desired report in Docyt.
- To export your report to Excel or PDF format, go to the top right corner of the report page and find the three-dots menu icon (...). Click on the three dots to reveal the menu options, and from there, select 'Export as Excel' or 'Export as PDF'.

- A notification will appear, indicating that the report can be downloaded from the 'Data Export' section of Docyt.

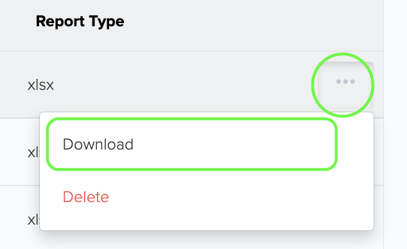
- To download the report, navigate to the 'Data Export' section by clicking the 'Data Export' link in the notification. Click the ellipsis menu on the 'Data Export' page and select the 'Download' option.

Note: This report is available only for select Docyt Plans. For more information, email support@docyt.com.
Report Components and Sections
- Assets: Resources owned by the business (cash, accounts receivable, inventory, etc.) showcasing value and liquidity.
- Liabilities: Debts and obligations (loans, accounts payable, etc.) outlining short and long-term financial responsibilities.
- Equity: The net worth, including owner's investments, retained earnings, and other contributions. Shows residual interest after deducting liabilities from assets.
Benefits
The Balance Sheet report allows stakeholders to evaluate the following:
- Financial Position: A snapshot of the business's financial status at a specific time.
- Liquidity: The ability to convert assets into cash for short-term obligations.
- Debt Management: The ratio of liabilities to assets, indicating the business's leverage.
- Equity Evaluation: The measure of profitability and return on investment.
How to Use the Variance Calculation Feature
Step 1: Access the Balance Sheet Report
- Open the balance sheet report.
- Look for the new "Customize" dropdown menu.
Step 2: Select Your Comparison Period
In the "Customize" dropdown, you will find the following options:
- Previous Period
- Last Year
Step 3: Understanding the Default Columns
When you select an option, the balance sheet report will show specific columns by default:
-
Previous Period (PP $):
- Variance: Difference between current and previous period.
- Variance %: Percentage difference between current and previous period.
-
Last Year (PTD LY $):
- PTD LY Variance: Difference between current and last year.
- PTD LY Variance %: Percentage difference between current and last year.
Step 4: Single Month Selection
When you select "Previous Period" from the "Customize" dropdown, the report will display:
- PP $: Balance as of the last date of the previous month.
- Variance: PTD $ - PP $.
- Variance %: (Variance / PP $) x 100.
When you select "Last Year," the report will display:
- PTD LY $: Balance as of the last date of the previous year.
- PTD LY Variance: PTD $ - PTD LY $.
- PTD LY Variance %: (PTD LY Variance / PTD LY $) x 100.
Step 5: Multiple Period Selections
If you select both "Previous Period" and "Last Year," the report will show:
- PTD $
- PP $
- Variance
- Variance %
- PTD LY $
- PTD LY Variance
- PTD LY Variance %
This structure applies to each selected month.
Example Calculations
- PP $ Calculation: If you select January 2024, PP $ will fetch the balance as of January 31, 2023.
- PTD LY $ Calculation: If you select January to March 2024, PTD LY $ will fetch the balance as of March 31, 2023.
What To Do If Your Report Data Is Not Accurate
For inaccurate data:
- Consult with your Docyt Account Manager for guidance and resolution.
- For general support questions, please email Docyt support at support@docyt.com for help troubleshooting and resolving discrepancies.